 IB Docs (2) Team

Questionnaires and surveys
 In addition to the qualitative and quantitative research methods already discussed in this chapter, there are two other commonly used methods - questionnaires and surveys. Unfortunately, many people use these terms interchangeably. However, there is a clear difference between the two methods.
A questionnaire is any written set of questions. The goal of the questions is to collective qualitative data with regard to a person's opinions and/or attitudes. Questionnaires are sometimes referred to as "written interviews." It is common in interviews that the questions be sent to an interviewee in advance. In addition, many interviews today are "email interviews" in which questions are responded to by email - essentially making the interview a questionnaire.
A survey, on the other hand, is both a set of questions and the process of collecting, aggregating, and analyzing the responses from those questions. One of the most common examples of surveys is the Likert Scale. The Likert scale is a five (or seven) point scale that is used to allow the individual to express how much they agree or disagree with a particular statement. Surveys produce quantitative data that can be analyzed through the use of descriptive statistics.
The following are examples of Likert scale questions:
I think that the IB is preparing me well for my future study of psychology.
strongly agree agree undecided disagree strongly disagree
I read my psychology notes...
Daily Often Sometimes Rarely Never
I believe that the study of psychology is
Very important Important Moderately important Slightly important Unimportant
Analyzing Surveys
 Many organizations make the mistake of applying the mean to analyze their survey findings. Why is this a mistake?
The problem lies in the type of data that we get when we use a Likert Scale. The data is "ordinal" - that is, it is ranked data. We cannot presume that the differences between the intervals are equal. We also cannot determine that everyone interprets the value of "often" and "sometimes" as the same. Therefore, the only statistics that should be applied are the median and mode.
However, even with these statistics, one has to be careful. For example, let's take the following example.
Your school carries out an assessment of the online learning that took place during lockdown.
One of the key questions that you ask is: How effective was the online learning program that was offered in our IB program?
Poor; learning was heavily impacted
Needed improvement; learning was negatively impacted
Satisfactory; there were opportunities for learning
Good; learning continued as usual
Excellent; learning improved as a result of online learning
When the IB coordinator calculated the median score, much to his delight, the score was 3.5! Considering how difficult the situation was during the pandemic, this appears to be good news! However, is he right to be so optimistic?
There are two further ways that he should look at the data. First, he should look at the mode of the data - that is, the most commonly received score - and the variation ratio. If there were 100 respondents and the most commonly chosen response was 4, then this is good news. Well, maybe good news.
The variation ratio is equal to 1 - (the mode/sample size). If 64 people said that the program was "good" (4), then the VR = 0.36. That is, 36% of the people in the sample did not agree with the most commonly given response. However, let's say that the most common response was only 28 people. This gives us a VR of 0.72 - in other words, 72% of respondents did not agree with the mode. This would not be the best news.
Finally, we can create a box plot. This will give us a good sense of the variance of the data. Take a look at the two box plots below. Which one would be the better news for our IB coordinator?
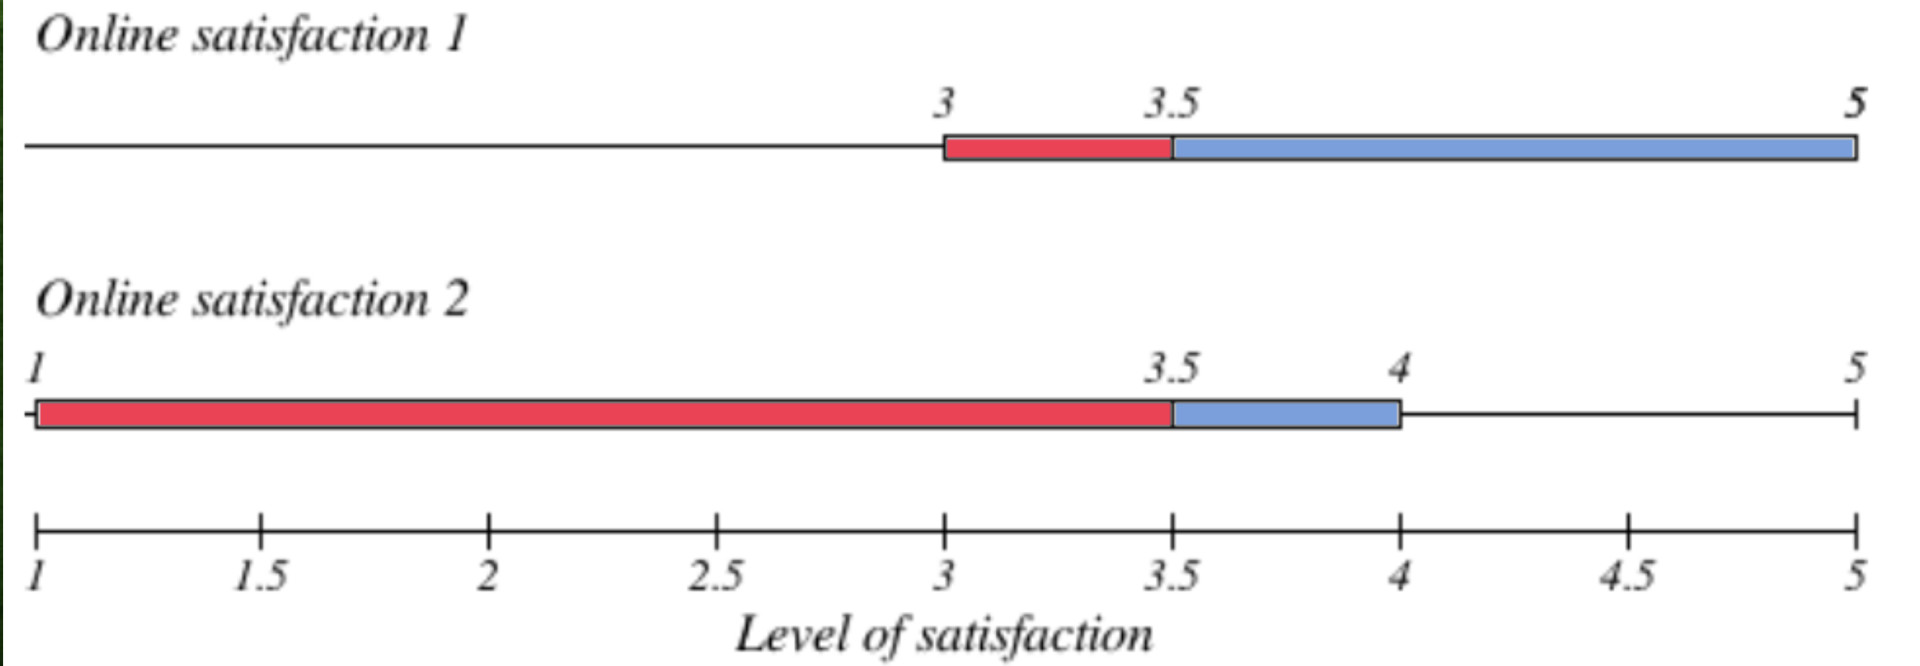
The box plot shows us the interquartile range of the data. This is the range of 50% of the data. In both cases, the median is 3.5, but notice the difference. In the first set of data, the skew is to the right, which means that there were more high scores. You can see that 50% of the data does not include a score below 3. That is good news! It also means that another 25% is going to be at the level of 5. Also very good news. So, the remaining 25% of the scores have the potential scores for being 3 or below.
The second box plot, however, is bad news for the school. Although the median is 3.5, at least 25% of the community gave the online program a score of 1. Another 25% between 1 and 3.5. 25% gave a score between 3.5 and 4. This leaves 25% that gave a score of 4 or higher. With at least 25% of the community saying that learning was heavily impacted, regardless of the median score, the school needs to really rethink what they are doing.
Likert Scales have the advantage that they allow for degrees of opinion, and even no opinion at all.
Unlike in questionnaires, quantitative data is obtained, which means that the data can be analyzed using statistical methods.
The validity of the Likert scale attitude measurement can be compromised due to social desirability.
There are cultural differences in the approach to Likert Scales. Lee et al (2001) found that Japanese and Chinese respondents were more likely to "gravitate to the mean" and choose "undecided" or "no opinion" more frequently than American participants, who were more likely to choose the extremes, especially when the question asked about opinions that were emotionally based.
Like surveys, questionnaires are easy to administer and they can generate a lot of data.
Questionnaires lead to rich, qualitative data. Surveys ask participants to make choices. This means that they may choose the "best answer" that may only partially reflect what they think.
Questionnaires are more difficult to analyze than surveys. Statistical analysis cannot be easily applied. Usually, researchers use either a deductive or inductive content analysis, looking for trends in the responses. This process is time-consuming and may be open to researcher bias.
The validity of a questionnaire can be compromised due to social desirability.
If any questions are misunderstood, so participants may complete them incorrectly. In addition, researchers have to be careful that the questions are not leading questions that would unduly influence the response of the participants.
Research methods vs data collection
One of the problems with surveys and questionnaires is that they are not always the research method - they are sometimes used simply for data collection. We will see several examples throughout the course.
An example of when a questionnaire is the research method is a study carried out by Brown & Kulik (1977). In this study, participants were asked about their memories of the death of a loved one, as well as the death of two public figures. This was very similar to an interview, but in order to gather the data quickly and efficiently, they used questionnaires. The results summarize the responses that were given by the participants.
When the questionnaire is the research method, the findings of the study are based solely on the responses that were obtained in the questionnaire. However, sometimes the questionnaire is simply part of an experiment, and it is not the research method itself. In a study by Bradbury and Fincham (1992), researchers carried out an overt, lab observation of couples talking about a problem that they are having in their relationship. Prior to the observation, each participant was asked to fill in a questionnaire about problems they have in their marriage. In this case, the questionnaire is not the research method, but a means of gathering data that is necessary for carrying out the observation.
Another classic example is Loftus & Palmer (1974) in which the researchers gave the participants a questionnaire with a leading question: How fast were the cars going when they smashed into each other? Although a questionnaire was used, it was only to obtain data, not the actual research method - which was an experiment. In this study, a clear independent variable was manipulated. The questionnaire was simply one of the materials for the experiment.
Surveys suffer from the same problem. Surveys may be the research method when the results are frequencies - e.g. 80% of Americans felt that they did not have enough free time to exercise. A study by Novotny and Polonsky (2011) used surveys to determine the level of tolerance for Muslim culture among Czech and Slovak university students.
However, more often we see one of two research methods that include surveys.
Experiments often use surveys. An experiment carried out by Joiner et al (1999) administered surveys to determine participants' thinking patterns before exam season. This was a natural experiment where participants were not able to be randomly allocated to groups because they were classified by the survey results. The independent variable was the exam season stress.
It is very important on the IB exam that you do not write about questionnaires or surveys but then use an example of a study that is actually an observation or experiment. This would result in a maximum score of 4 on an SAQ and a loss of 6 marks for the ERQ.
If you are not sure about whether a study is a questionnaire or survey - or actually a different research method, ask yourself the following questions:
- What was the goal of the questionnaire or survey?
- Were participants allocated to conditions? If so, this is most likely not a questionnaire or survey study.
- Were the results of the questionnaire summaries of the responses? Were the results of the survey frequencies or medians/IQR of specific questions? Survey data can also demonstrate correlational findings, as seen in the study above by Novotny and Polonsky (2011).
- Was the study described as an observation or experiment in its description in the textbook?
 Twitter
 Facebook
 LinkedIn