 IB Docs (2) Team

Wilcoxon Signed Ranks Test
 When writing the IA, nothing seems to worry students (and teachers) more than the application of inferential statistics. And yet - it is actually not as difficult as it may seem.
The Wilcoxon Signed Ranks test is used when we have a repeated measures design. The Wilcoxon Signed Ranks test is a safe test to use for the small sample sizes that are typical of the IA. Also, since we often do not have a standard distribution of data, but often have outliers, a test with a higher level of power is not recommended.
- The study uses a repeated measures design.
- The data is quantitative and at least at the ordinal level of data. The significance of data that is at the ratio or interval level may also be determined using the Wilcoxon signed ranks test - although it has lower power.
- The sample size is below 30. It is recommended for the IA in psychology that the Wilcoxon signed ranks test be used instead of a t-test, as sample sizes are generally low.
- The data is not normally distributed This may be due to outliers.
When you use a Wilcoxon signed ranks test, it is most relevant to graph the median value of the two conditions.
A Sample IA
One of the commonly done internal assessment replications is the study done by Craik and Lockhart (1971). In this study, participants are either asked to think about the spelling of the word (shallow processing) or to think of a mental image of the word (deep processing). As one list of 24 words was read, each condition has 12 pieces of data for each participant. The following data is the total number of words remembered by each participant for both conditions: shallow and deep processing.
| Shallow processing | 6 | 4 | 3 | 9 | 5 | 7 | 6 | 4 | 2 | 8 | 5 | 5 |
| Deep processing | 7 | 9 | 6 | 11 | 6 | 5 | 9 | 7 | 5 | 8 | 10 | 7 |
To calculate the level of significance, we can use the program Vasserstats.net. To calculate the Wilcoxon signed ranks test, click on "Ordinal Data" in the left-hand margin.
The program will ask for the size (n) of the sample. Please enter the value n = 12.
The program will then explain the nature of the test to the reader. You may or may not be interested in this. Scroll down to Data Entry.
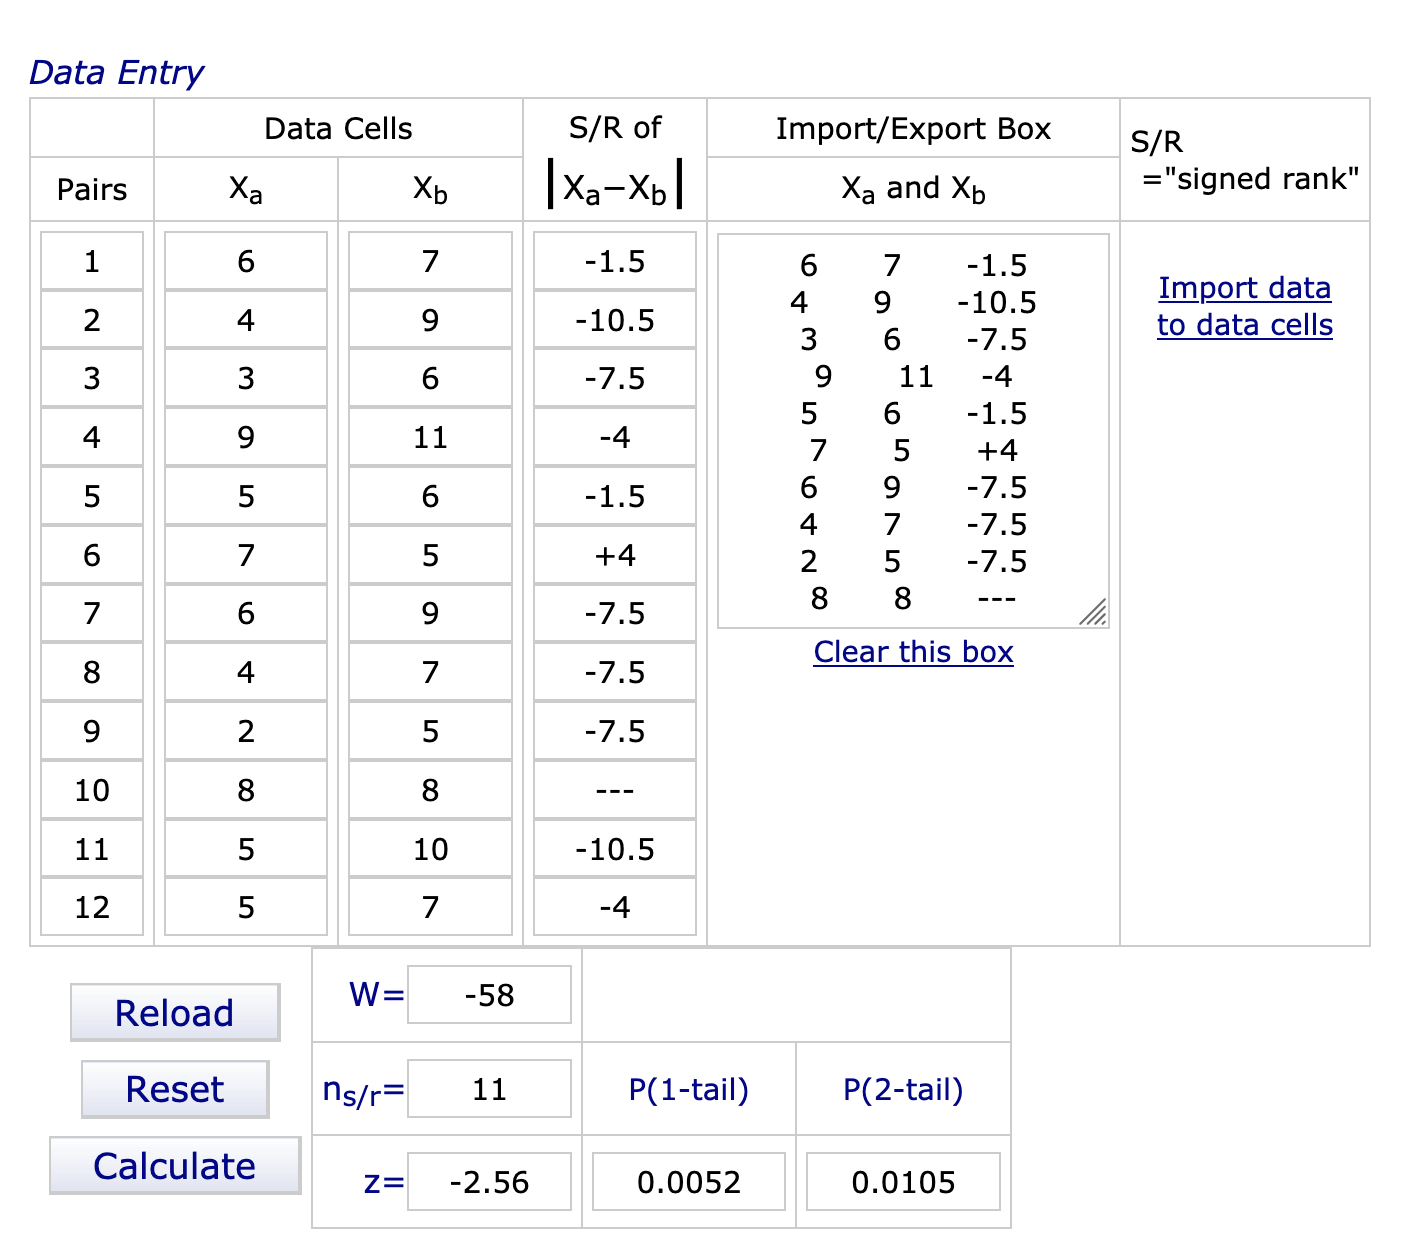 Enter the raw data into import raw data. The easiest way to enter the data is to copy and paste it from an Excel spreadsheet. Put your data into two columns in your spreadsheet and then paste them into the "Import/Export Box." Then click on "Import data to data cells."
Then click on "Calculate."
Add up all of the negative numbers in the S/R of |Xa and Xb|. Then add up the positive numbers. The larger value is 62; the lower value is 4. Your T value is the lower number and the W value is the larger value minus T.
Now for the final step. Looking at the value for the one-tailed test, we can see that the p-value is 0.0052. In order for us to reject our null hypothesis, the p-value must be ≤ 0.05. Therefore, we may reject the null hypothesis; the difference between the two conditions is significant.
Reporting the statistics
There is a specific way that we should report statistics when we carry out a study. When we use the Wilcoxon signed ranks test, it should look like this:
On average, the participants appeared to recall fewer words in the shallow condition (Mdn = 5) than in the deep condition (Mdn = 7). A Wilcoxon signed-rank test indicated that this difference was statistically significant, T = 4, z = -2.56, p < 0.005.
When writing out the statement of significance, Mdn is the median.
P-values
Often people will tell you that you should only report p ≤ 0.05, 0.01, 0.001 - and that you should not report the exact p-value. Although that used to be true when we had to use critical values tables in the back of statistics books to determine whether our data are significant, this is no longer the case.
According to the 6th edition of the APA style manual, "when reporting p values, report exact p values (e.g., p = .031) to two or three decimal places. However, report p values less than .001 as p ≤ .001." (p. 114)
Would you rather watch than read?
The following screencast will demonstrate how to use Vassarstats. Although the data is different, the process is the same.
Calculating the Wilcoxon signed ranks test
Although it is not required, many students like to actually know what is happening mathematically. Carrying out the test by hand is also a good way to check your work to make sure you have done your online calculation correctly.
The first step is to make an amendment to the table above.
In the third column, you find the difference between the two scores. It does not matter which way you do it, but it is best to do it in the direction of the prediction of the effect. So, deep processing is expected to be higher in value than shallow processing.
| Participant | Shallow processing | Deep processing | Difference (B - A) | Rank of difference |
| 1 | 6 | 7 | 1 | 1.5 |
| 2 | 4 | 9 | 5 | 10.5 |
| 3 | 3 | 6 | 3 | 7.5 |
| 4 | 9 | 11 | 2 | 4 |
| 5 | 5 | 6 | 1 | 1.5 |
| 6 | 7 | 5 | -2 | 4 |
| 7 | 6 | 9 | 3 | 7.5 |
| 8 | 4 | 7 | 3 | 7.5 |
| 9 | 2 | 5 | 3 | 7.5 |
| 10 | 8 | 8 | 0 | - |
| 11 | 5 | 10 | 5 | 10.5 |
| 12 | 5 | 7 | 2 | 4 |
To calculate the rank of difference, only use the absolute value - do not worry if it is negative! If there is a zero, this data should be excluded from the ranking. The lowest absolute value should be “1.”
If two values share the same position, then you should take the positions and average them. So, you will see that the value “1” is both the 1st and 2nd lowest rank. So, we take the average of the two and each receives a rank of 1.5. The next value, 2, shares positions 3, 4, and 5, for an average of 4.
Now we find the sum of the ranks of all of the positive differences and all of the negative differences. The sum of the positive is 4. The sum of the negative ranks is 62. Notice that when we add the -62 and the +4, we get the W value of -58, which is used by Vassarstats.
How do I know if my results are significant?
To use the critical values table, we use the T value, which is either the sum of the positive or the negative ranks - whichever is smaller. In this case, T = 4. The sample size (n) is equal to the total sample minus any participants who had no difference between the conditions. For this study our n = 11.
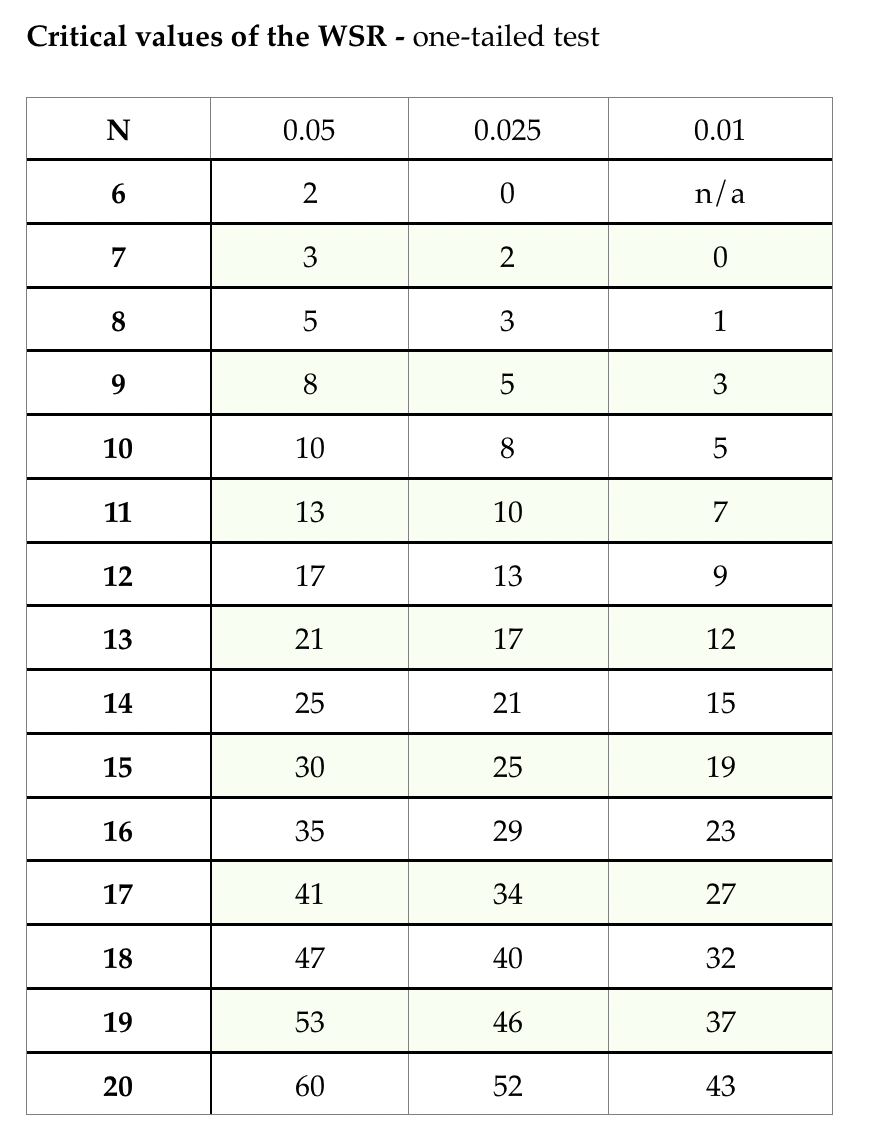
In the sample size column (N), if you go down to the row for a sample of 11, it tells us that for a significance level of 0.05, we need a T value of 13 or less. We can then continue across the row. Since for a p-value of 0.01 we need a T value of 7 or less, we can reject our null hypothesis. It appears that the level of processing had a significant effect on the number of words recalled from the 24-word list.
The statement of significance will be slightly different from what is above.
On average, the participants appeared to recall fewer words in the shallow condition (Mdn = 5) than in the deep condition (Mdn = 7). A Wilcoxon signed-rank test indicated that this difference was statistically significant, T = 4, p < 0.01.
 Twitter
 Facebook
 LinkedIn