 IB Docs (2) Team

Chi squared
 The Chi-squared of independence is used when we have categorical data - in other words, the data is not numeric. The level of data of such studies is nominal. When using online calculators, please be careful to choose the right chi-squared test. There are two more: the chi-squared test of homogeneity and the chi-squared test of best fit.
Below you will see how to apply the statistic to a typical IA - the second version of Loftus and Palmer's study of leading questions: was there actually broken glass?
- When data is non-numeric. This type of data is called categorical or nominal data.
- When the experiment uses an independent samples design.
- When you have data that is not a normal distribution. Then you can "convert" the data to nominal and carry out the chi-squared which has lower statistical power. See the presentation: Power and statistics
When you use a Chi-squared of difference test, it is most relevant to graph the frequency of the two conditions.
A Sample IA
One of the commonly done internal assessment replications is the study done by Loftus and Palmer (1974). In this study, participants were given questionnaires after watching a video of a car accident. On the questionnaires, there was a leading question that was different for each of the two groups: How fast was the car going when it smashed into the other car? and the other group was asked, How fast was the car going when it hit the other car? After a period of time, the participants were brought back and asked if they had seen broken glass in the video.
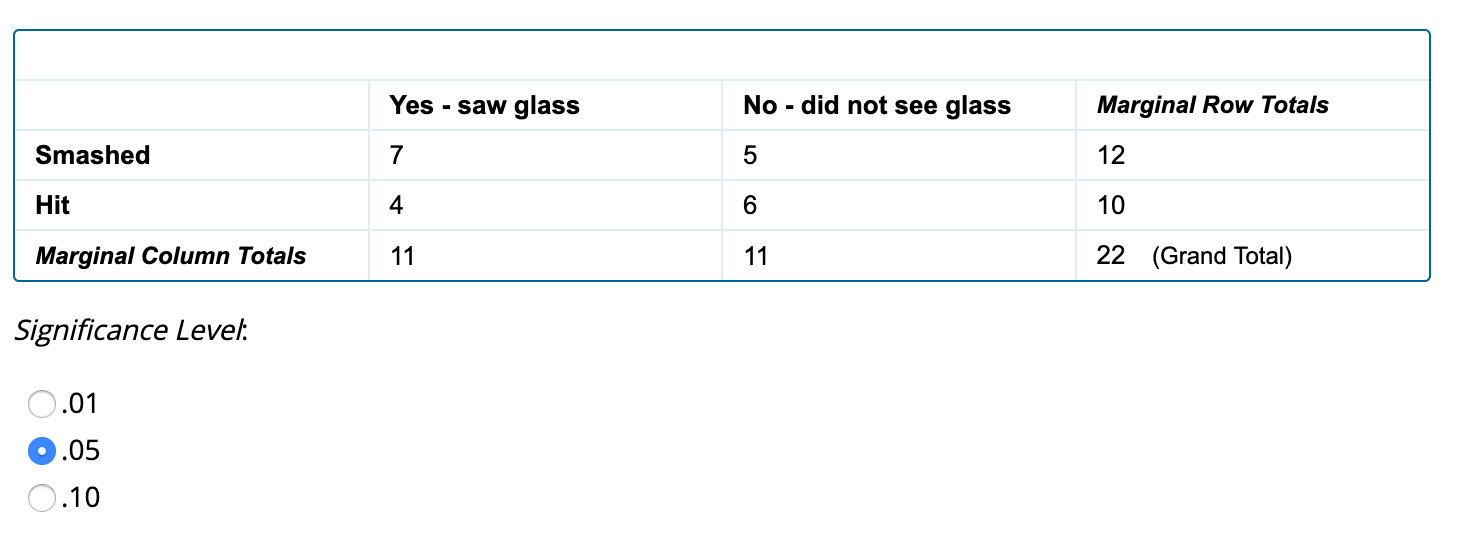
Let's say that you have 12 participants in group 1 and 10 participants in group 2. The data for the two groups is in the table below.
| Smashed | Yes | No | No | Yes | Yes | No | Yes | Yes | No | Yes | Yes | No |
| Hit | No | No | Yes | No | No | Yes | Yes | No | Yes | No |
In order to now calculate the chi-squared value, you can use the Chi-squared calculator.
When you enter the labels, you should put the levels of the dependent variable across the top and the independent variable down the left-hand side.

Then enter the frequency for each condition and press "calculate."
It is best to test the data at p < 0.05 first. When you press the calculate button, you get this result.
Reporting the statistics
There is a specific way that we should report statistics when we carry out a study. When we use the chi-squared test, it should look like this:
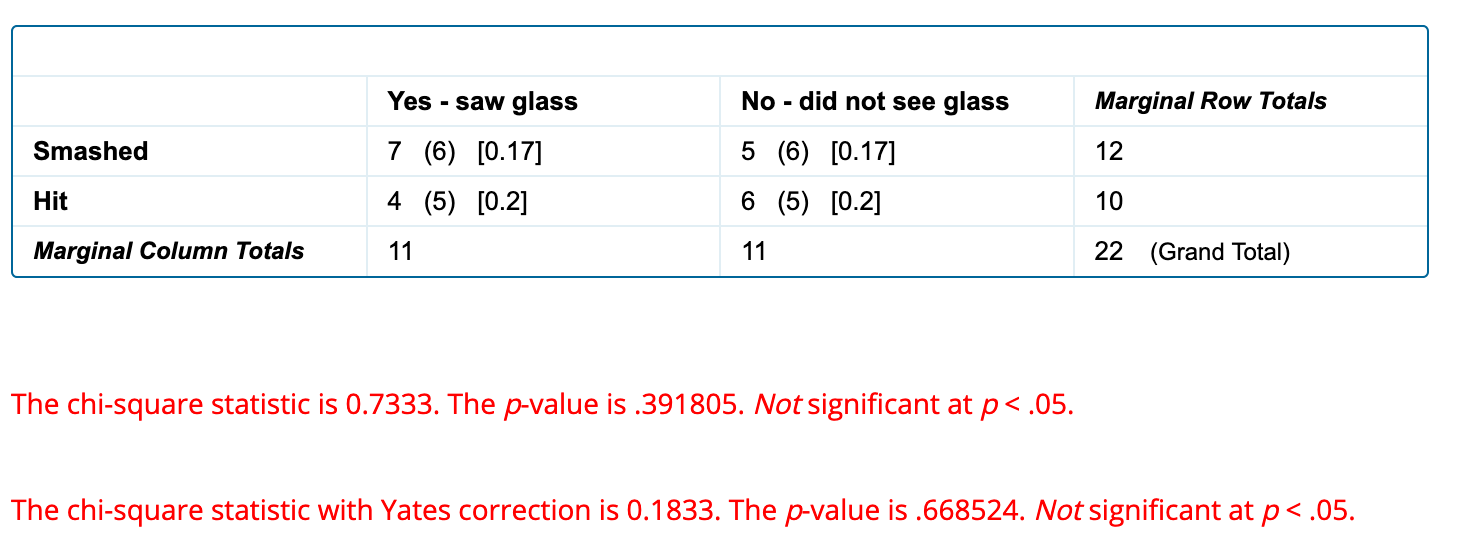
A chi-square test of independence was performed to examine the relation between the intensity of a verb and whether the participants showed distorted memory and remembered seeing broken glass. The relation between these variables was not significant, X2 (1, N = 22) = 0.7333, p = .3918. It appears the intensity of the verb had no significant effect on participants' memory.
1 is the degrees of freedom and N is the sample size. The value 0.7333 is the chi-squared value.
Calculating the Chi-square
Although it is not required, many students like to actually know what is happening mathematically. Carrying out the test by hand is also a good way to check your work to make sure you have done your online calculation correctly.
To set up a chi-square, we want to first of all set up a table that demonstrates the categories on which our study is based - in other words, the independent variable. In this study, the variable is whether the participants had the word "smashed" or "hit." in their leading question. We could set up a chi-square table that looks like this:
| Saw broken glass | Didn't see broken glass | Totals | |
| Smashed | 7 | 5 | |
| Hit | 4 | 6 | |
| Totals |
We then need to add up the columns and the rows - like this.
| Saw broken glass | Didn't see broken glass | Totals | |
| Smashed | 7 | 5 | 12 |
| Hit | 4 | 6 | 10 |
| Totals | 11 | 11 | n = 22 |
The formula for the chi-square is:
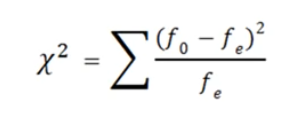 Where f stands for frequency, o stands for observed value and e stands for expected value. To find the expected frequency values, we multiply the total frequency of the column times the total frequency of the row and divide by the sample size. So, for the smashed condition that saw glass, it is (12 * 11)/22 which is 6.
| Saw broken glass | Didn't see broken glass | Totals | |
| Smashed | O = 7; e = 6 | O = 5; e = 6 | 12 |
| Hit | O = 4; e = 5 | O = 6; e = 5 | 10 |
| Totals | 11 | 11 | n = 22 |
Now we plug the “e values” into the formula above.
X2 = (7 - 6)2 + (5 - 6)2 + (4 - 5)2 + (6 - 5)2
6 6 5 5
X2 = 0.16 + 0.16 + 0.2 + 0.2
X2 = .72
Interpreting the Chi-square
The next step is to determine our degrees of freedom. To do this we use a very simple formula:
df = (rows - 1)(columns - 1)
So, for our study above, we have 2 rows and 2 columns of data. In other words:
df = (2 - 1) (2 - 1)
df = 1
This makes sense as in each condition, they had two different options. If they chose option 1, they had one other choice. This is what is meant by 1 degree of freedom.
Below you will see the chi-square critical values table. You can see that if we look at column 1, this column is for the degrees of freedom. So, for our experiment, we will use the data in the first row.
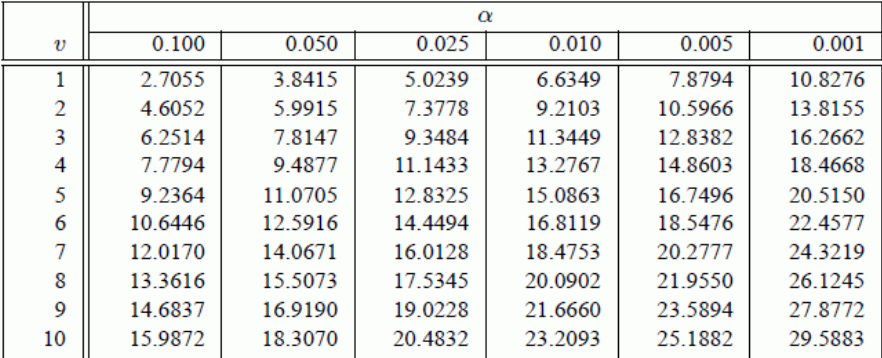
Remember, we need to have a minimal p-value of 0.05. To get this, we will need a chi-square value of 3.8415 or higher. In other words, 3.8415 is the critical value that must be exceeded in order to determine that our data is significant.
As you can see, the value of chi-square is less than the critical value of 3.84 which is necessary for us to reject the null hypothesis. This means that our results are not significant.
The Yate's Correction
Although some people recommend that you should use the correction only if your expected cell frequency is below 10 or even 5, others recommend that you don’t use it at all. A large body of research has found that the correction is too strict.
The IB does not require that you run a Yate's correction.
For more information on the topic, see this link.
 Twitter
 Facebook
 LinkedIn