 IB Docs (2) Team

Independent samples t-tests
 When writing the IA, nothing seems to worry students (and teachers) more than the application of inferential statistics. And yet - it is actually not as difficult as it may seem.
The independent samples t-test is used when we have an independent samples design. The t-test is used with larger sample sizes. Using the t-test with smaller sample sizes may lead to a Type I error - that is, the rejection of a true null hypothesis. If you have a sample size smaller than 30, you should test the normality of the distribution of your data before carrying out the t-test; otherwise, the use of the test is not justified.
- The study uses an independent samples design.
- The data is quantitative and at the interval or ratio level of data.
- The sample size is 30 or more. It is recommended for the IA in psychology that the Mann Whitney U test be used instead of a t-test for sample sizes lower than 30.
- The data is normally distributed. In sample sizes less than 30, evidence of normal distribution should be provided to justify the use of the t-test.
A sample IA
One of the commonly done internal assessment replications is the study done by Glanzer and Cunitz (1966). The aim of the study was to test the recency effect. The recency effect is the concept that information that is not rehearsed is still in short-term memory and so can be recalled. However, when short-term memory is used for another task, if not rehearsed, this information will be displaced and lost - and the recency effect will not be shown. I
In their study, participants were presented with the same list of words. In the original study, there were three conditions, but in the replication, it is common that one group recalls the words immediately after presentation, while the other group recalls the words after waiting 30 seconds. The participants in the second group count backward by threes (the Brown-Peterson technique) to prevent rehearsal.
In this replication, the list of words had 18 words. The DV was the number of words recalled from the final six on the list. The order of the words is not important.
Let's say that we have a sample of 25 participants. 11 are in the "immediate recall" condition and 14 are in the "delayed recall" condition. The following chart shows the data for this experiment.
| Immediate | 6 | 5 | 4 | 4 | 2 | 6 | 5 | 5 | 3 | 5 | 3 | |||
| Delayed | 2 | 1 | 4 | 0 | 4 | 0 | 5 | 3 | 3 | 4 | 3 | 2 | 0 | 4 |
The mean for the immediate condition is 4.36 with a median of 5. The standard deviation of the data is 1.22
The mean for the delayed condition is 2.5 with a median of 3. The standard deviation of the data is 1.63.
The question is - is there a significant difference between the average number of words recalled in the immediate and delayed conditions?
First, we need to find out if our data is normally distributed.
Checking for a normal distribution
The Central Limit Theorem assumes that the larger the sample, the more likely we are to have a normal distribution. Here is an explanation of the theorem. (Students studying statistics in IB math probably already know about this theorem!)
The general guidance for a normal distribution is to have a sample of 30 or more. However, the t-test may be used with smaller samples if we can show that the sample is normally distributed. How do we do this?
The test for normality is called the Kolmogorov-Smirnov test [K-S]. It is designed to test normality by comparing your data to a normal distribution with the same mean and standard deviation as your sample. If the test is NOT significant, then the data are normal, so any value above .05 indicates normality.
The easiest way to do this test is to use an online calculator. A good example can be found here.
When you click on the link, enter your data for each group into the boxes, separating the data by commas. Your data entry should look like the image below.
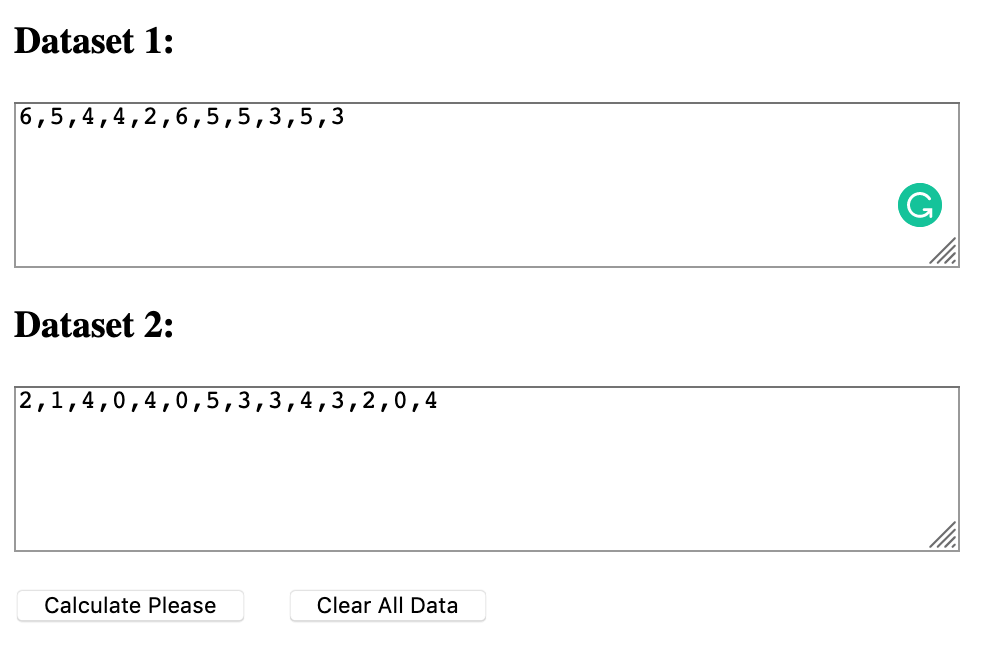
You then press "calculate please." If your data is normally distributed, as is the case here, you will get a message that confirms that for each of the two conditions. This evidence should be included in your report as follows:
We carried out a Kolmogorov-Smirnov test to see if the data is consistent with a normal distribution. Both conditions were normally distributed. In the immediate recall condition, p = 0.65; In the delayed recall condition, p = 0.72. Therefore, it is justified to carry out a t-test.
If the test tells you that the sample is not normally distributed, you should run a Mann-Whitney U.
Calculating the independent samples t-test
The t-test is quite a complex test to calculate by hand. For this page, we will use the calculator on Social Science Statistics to calculate the p-value of the data above.
When you open the calculator, you should see that it says: T-Test Calculator for 2 Independent Means.
Click on "t-test calculator"
Enter your data into the two boxes. It is easy to just copy and paste from a spreadsheet.
Remember to click on "one-tailed" test. The convention is to also choose 0.05 as the p-value. The reason for this is that if the results are not significant at 0.05, they will not significant at any level.
When you press calculate, you will see that the results are significant and a more precise p-value is given. The statement of significance is in blue.
The t-value is 3.01742. The p-value is .003067. The result is significant at p < .05.
You should print the entire page of the calculation and include it in an appendix of your IA.
Reporting the statistics
We can see from the table above that our results are significant. We can reject the hypothesis. It appears that the delay with a distractor task did have a significant effect on the recency effect. So, how do we write our statement of findings?
When reporting the results of a t-test, the correct way to report them is as follows:
t(degrees of freedom) = the t statistic, p = p-value.
Degrees of freedom = n - 1
So, using our example above, the statement of the findings would read as follows:
There was a significant decrease in the number of words recalled in the delayed condition (M = 2.5, SD = 1.63) than in the immediate recall condition (M = 4.36, SD = 1.22), t(24) = 3.01742, p = .003067.
P-values
Often people will tell you that you should only report p ≤ 0.05, 0.01, 0.001 - and that you should not report the exact p-value. Although that used to be true when we had to use critical values tables in the back of statistics books to determine whether our data are significant, this is no longer the case.
According to the 6th edition of the APA style manual, "when reporting p values, report exact p values (e.g., p = .031) to two or three decimal places. However, report p values less than .001 as p ≤ .001." (p. 114)
 Twitter
 Facebook
 LinkedIn