Testing for significance
 It could easily be argued that in the modern world of technology, there is no reason to teach students how to do inferential statistics. Once they have their data, they just need to know how to choose an appropriate test and to enter the data. I am in full agreement.
But students do have to be able to interpret the information that results from putting that data into the program. And this is where the concept of significance comes in. Significance is the probability that the results that we have obtained are due only to chance. How the formula actually figures this out is not important for IB Psychology - but the ability to determine the level of significance and what it means for the experiment is one of the essential understandings of the experimental method.
Hypotheses
The first thing that students need to understand is the concept of a hypothesis. The experimental method is based on hypothesis testing. Inferential testing asks the researcher to choose between a null and an alternative (research) hypothesis. You are actually calculating the probability of the result occurring if the null hypothesis is true.
The first step is to state the null hypothesis. The null hypothesis assumes that there will be no difference for a given population under two different conditions. For example, there will be no difference in the number of words recalled from a list of 40 unrelated words when listening to music or not listening to music.
The next step is to state an alternative hypothesis. This is the guess about what will happen when we manipulate the independent variable and measure its effect on the dependent variable.
What is significance?
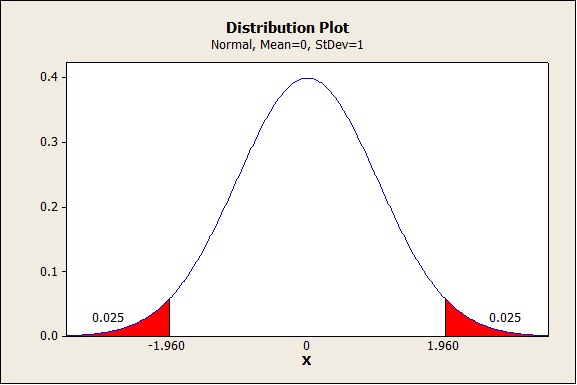
Significance is the probability that our results are due only to chance. The accepted level of probability that is tolerated is p < 0.05 - that is, there is a five percent (or less) chance that our results are due only to chance. That means that our results are significant. This is determined by finding "critical values." That is best understood by looking at the following graph:
 You can see red areas on both sides of the bell curve. Those red areas are the "critical areas" for your research. If your response is less than -1.96 or greater than 1.96, then your results are significant. If it falls anywhere in between those two values, then your results are most likely due to chance and you must retain your null hypothesis - that is, you will have to say that there is no difference between the two conditions.
So, if when I calculate a Mann Whitney U, the U value is 2.01, then I can say: The value of U = 2.01 exceeds the critical value of 1.96. We can reject the null hypothesis at p < 0.025. It appears that participants were able to recall more words in from a list of 40 unrelated words when listening to music.
Notice that the statement of significance has the following elements:
- The value obtained from the inferential statistics applied.
- The level of significance written as a statement of probability
- A restatement of the alternative or null hypothesis to clarify the findings.
Remember that a significant result does not prove anything; it simply supports the research hypothesis.

 IB Docs (2) Team
