 IB Docs (2) Team

ANOVA
 When writing the IA, nothing seems to worry students (and teachers) more than the application of inferential statistics. And yet - it is actually not as difficult as it may seem.
The ANOVA is used when we have an independent samples design and more than one level of the independent variable. The ANOVA may be used with small sample sizes which are typical of the IA.
The most common use of the ANOVA would be for Loftus and Palmer's (1974). The sample below, however, is based on Perham & Vizard’s (2010) study of types of music and their effect on recall.
- The study uses an independent samples design and there are more than two levels of the independent variable.
- The data is quantitative and at least at the interval/ratio level of data.
- Each condition has a minimum of eight participants.
- The data is normally distributed.
It should be noted that it is not recommended that students carry out replications that require the use of ANOVA for their internal assessment. Two levels of the independent variable are sufficient. If sample sizes are small, it is highly likely that the data is not normally distributed and the test may not be seen as valid.
A sample IA
One of the common IA's is Perham & Vizard’s (2010) study of the role of music in learning. In this partial replication of the experiment, 27 participants were asked to recall a list of 20 words. 9 participants studied the list in silence before carrying out a distractor task and then carrying out free recall - that is, writing down as many words as they could remember in any order. 10 participants were asked to listen to a piece of music that they enjoyed while carrying out the task; 8 participants were asked to listen to a piece of music they disliked while carrying out the task. The data is the chart below.
| Silence | 15 | 12 | 14 | 18 | 13 | 14 | 10 | 6 | 12 | |
| Liked music | 12 | 15 | 13 | 14 | 18 | 16 | 15 | 14 | 16 | 12 |
| Disliked music | 8 | 10 | 11 | 8 | 6 | 11 | 9 | 12 |
| Mean | Standard deviation | |
| Silence | 12.66 | 3.35 |
| Liked music | 14.5 | 1.90 |
| Disliked music | 9.37 | 1.99 |
We can see that there is a difference in the recall among the different conditions. The ANOVA is going to answer two key questions for us. First, is there a significant difference between conditions? So, does the silent condition have a significantly higher recall than the like music condition? What about compared to the disliked music condition?
The ANOVA also tells us if, overall, our data is significant. So, how do we do the test?
Calculating the ANOVA
The ANOVA is a very complex statistical analysis. Thankfully, we have online calculators. The calculator we are going to use can be found here.
When you open up the site, you will see that you have to choose a value for "k". This is the number of levels of the independent variable. In our study, there are three: silence, liked music, disliked music. Choose k = 3. Make sure the box under the k values is not clicked, otherwise the default "k = 4" will be used.
Then press "proceed to enter your treatment data." Enter your data into the boxes. Be sure to keep track of which condition is which letter. We will enter A: Silence, B: Liked; C: Disliked. Press "calculate ANOVA".
You will see a very long page of statistical analysis. What do you need to know?
First, what is the overall significance of the study? You will see that in the following box.
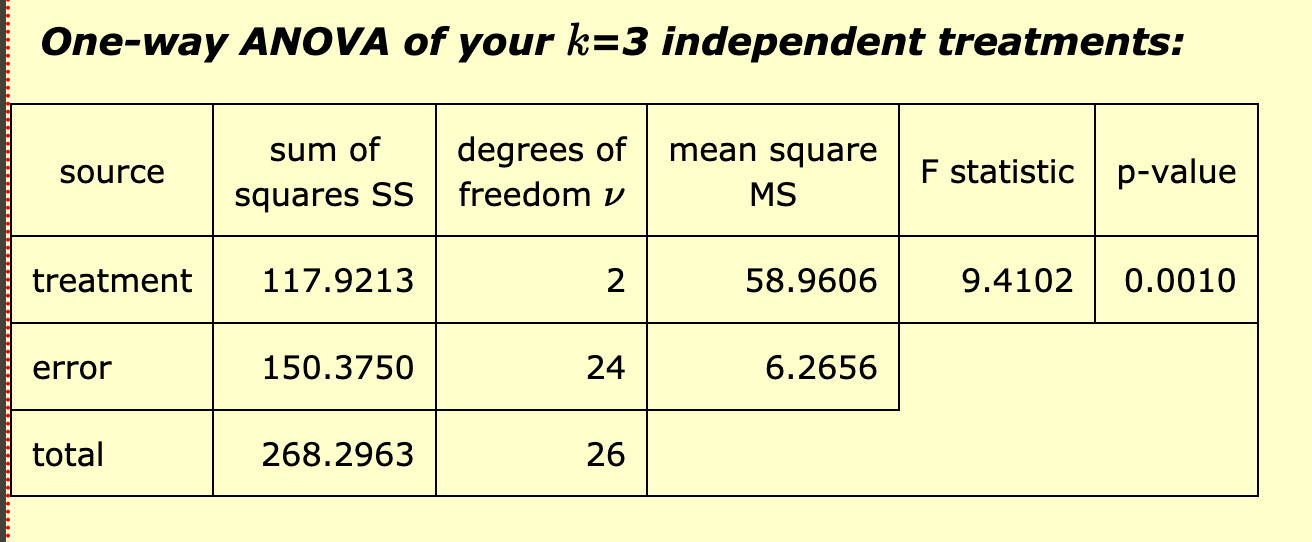
You can see that the p-value for this study is 0.0010. This means that we can reject the null hypothesis. In this case, the null hypothesis would have been that the mean number of words recalled is the same for all groups.
But what about the significance between the different conditions?
To find this out, the calculator automatically calculated the Tukey HSD test. The results can be seen in the table below.
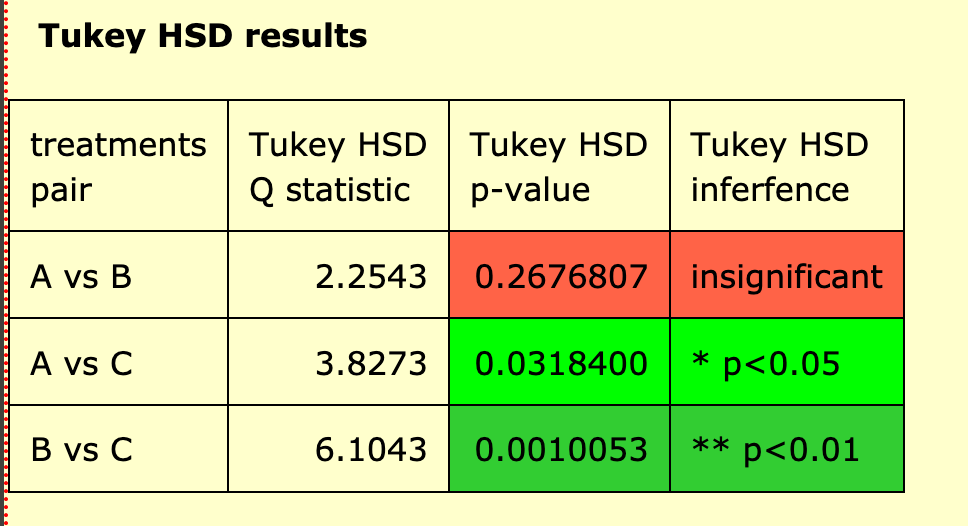
You can see that there was no significant difference between silence and liked music, but there was a significant difference between both silence vs disliked music - and liked vs disliked music.
In your IA, you must include both the One-way ANOVA results as shown above - and the Tukey HSD results shown here to the left.
Reporting our results
The first statement of significance looks at the overall significance of the findings.
The means (and standard deviations) of the number of words recalled for the silence, liked music, and disliked music were 12.66 (3.35), 14.50 (1.90), and 9.37 (1.99) respectively. These means differed significantly, F(2, 24) = 9.4102, p < 0.001.
After the F - 2 is the degrees of freedom (number of treatments - 1) and 24 is the "standard error."
This is then followed by a statement of findings with regard to the Tukey HSD results.
A post hoc Tukey HSD test showed that the means for the silent and liked music conditions formed homogenous subsets; the silent and disliked music conditions differed significantly at p < .05; the liked music and the disliked music conditions differed significantly at p < 0.01.
The term "homogenous subsets" means that there was no significant difference between these two conditions.
 Twitter
 Facebook
 LinkedIn