 IB Docs (2) Team

Mann Whitney U Test
 When writing the IA, nothing seems to worry students (and teachers) more than the application of inferential statistics. And yet - it is actually not as difficult as it may seem.
The Mann-Whitney U test is used when we have an independent samples design. The Mann Whitney is a safe test to use for the small sample sizes that are typical of the IA. Also, since we often do not have a normal distribution of data, but often have outliers, a test with a higher level of power is not recommended.
- The study uses an independent samples design.
- The data is quantitative and at least at the ordinal level of data. The significance of data that is at the ratio or interval level may also be determined using the Mann Whitney U test - although it has lower power.
- The sample size is below 30. It is recommended for the IA in psychology that the Mann-Whitney U test be used instead of a t-test, as sample sizes are generally low.
- The data is not normally distributed This may be due to outliers.
When you use a Mann-Whitney U test, it is most relevant to graph the median value of the two conditions.
A sample IA
One of the commonly done internal assessment replications is the study done by Loftus & Palmer (1974). The following data is for two conditions: smash and hit.
| Smash | 66 | 68 | 72 | 81 | 77 | 86 | 55 | 64 | 66 | 54 | 55 | 71 |
| Hit | 54 | 62 | 61 | 68 | 51 | 72 | 48 | 61 | 69 | 70 |
To calculate the level of significance, we can use the program Vasserstats.net. To calculate the Mann Whitney U Test, click on "Ordinal Data" in the left-hand margin.
- The program will ask for the size (n) of the first group (sample A), and then for the second group. You should always enter the larger value first. In this case, it is the "smashed" condition where n = 12. Then enter the value for the "hit" condition where n = 10.
The program will then explain the nature of the test to the reader. You may or may not be interested in this. Scroll down to Data Entry.
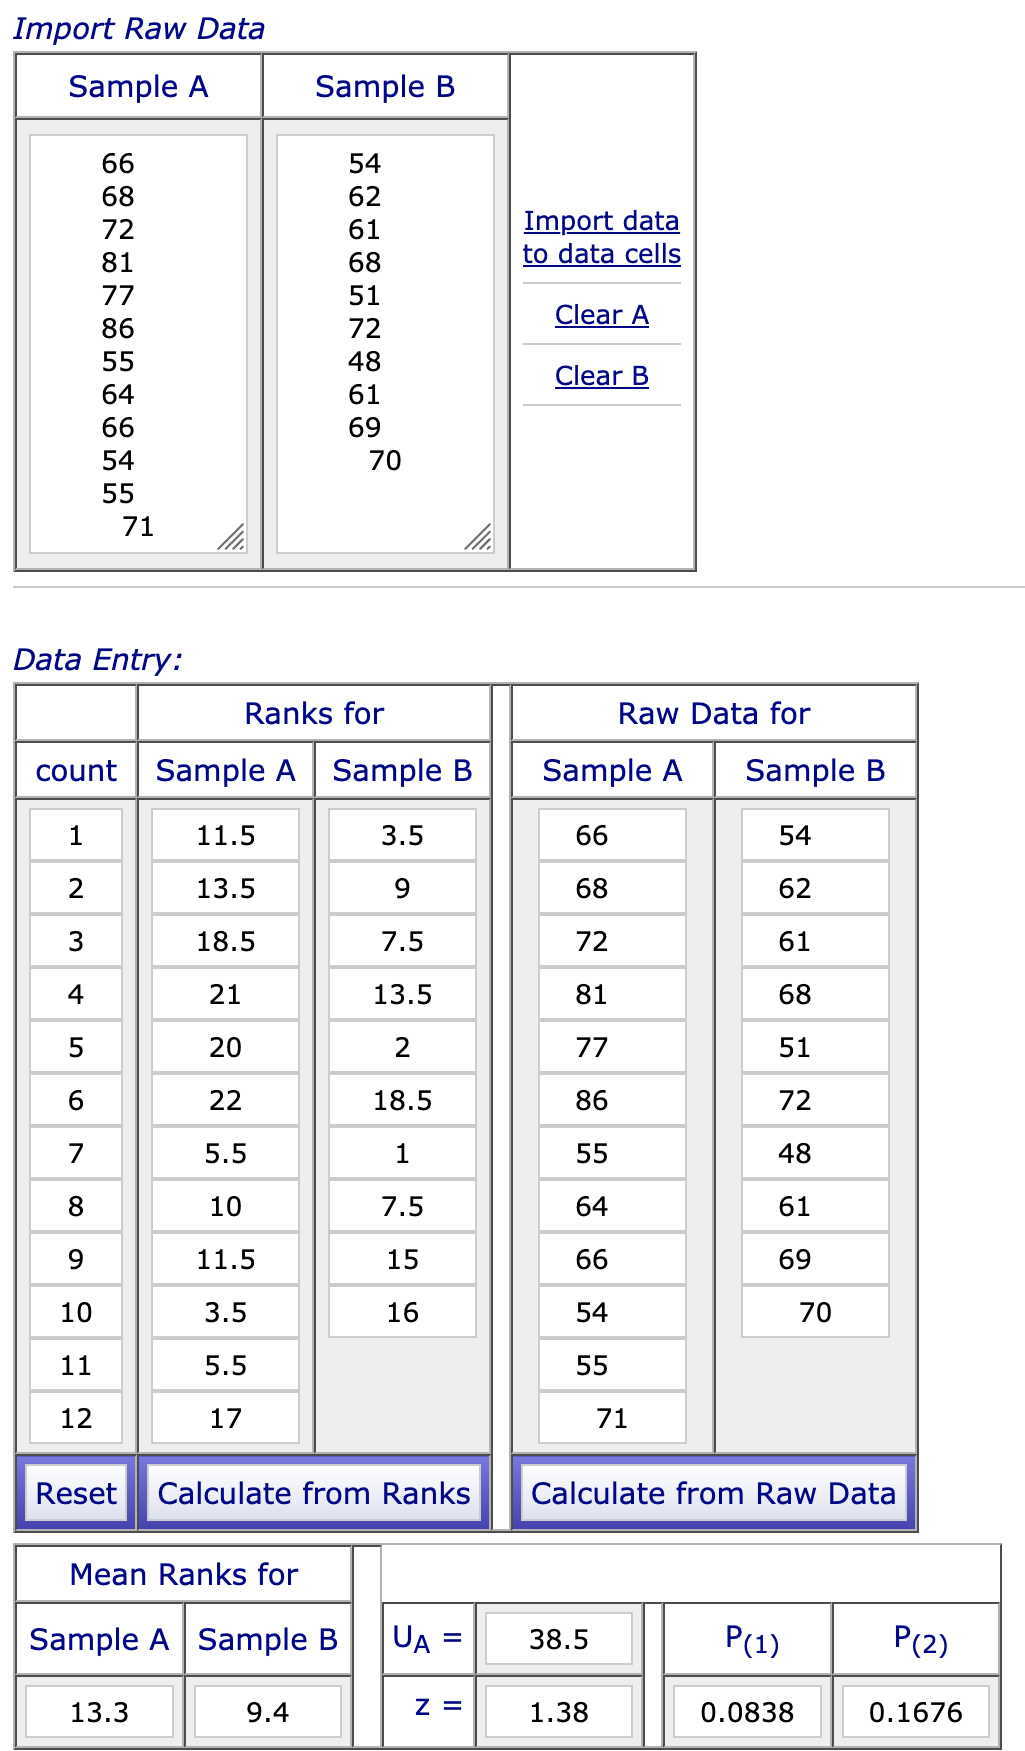
Enter the raw data into import raw data. The easiest way to enter the data is to copy and paste it from an Excel spreadsheet. Just be sure that you press return after each data point so that there is only one data point per line.
After you have entered the data, click on "Import data to data cells." The data should now be in the Raw Data table below.
Click on "Calculate from Raw Data."
You will see the Mann Whitney U value written as UA. In this case, you will see the value is 38.5.
Now for the final step. Looking at the value for the one-tailed test, we can see that the p-value is 0.0838. In order for us to reject our null hypothesis, the p-value must be ≤ 0.05. Therefore, we must retain the null hypothesis; the difference between the two conditions is not significant.
Reporting the statistics
There is a specific way that we should report statistics when we carry out a study. When we use the Mann Whitney test, it should look like this:
A Mann-Whitney U test indicated that there was no significant difference between speed estimates for the higher intensity verb "smashed" (Mdn = 67) and for the lower intensity verb "hit" (Mdn =61.5), U = 38.5, p = 0.0838.
Mdn stands for the "median."
P-values
Often people will tell you that you should only report p ≤ 0.05, 0.01, 0.001 - and that you should not report the exact p-value. Although that used to be true when we had to use critical values tables in the back of statistics books to determine whether our data are significant, this is no longer the case.
According to the 6th edition of the APA style manual, "when reporting p values, report exact p values (e.g., p = .031) to two or three decimal places. However, report p values less than .001 as p ≤ .001." (p. 114)
Would you rather watch than read?
The following screencast will demonstrate how to use Vassarstats to calculate the statistics shown above.
Calculating the Mann Whitney
Although it is not required, many students like to actually know what is happening mathematically. Carrying out the test by hand is also a good way to check your work to make sure you have done your online calculation correctly.
Steps to carry out a Mann Whitney U test:
- Organize the data in the table above from the lowest to the highest value.
| Smash | 54 | 55 | 55 | 64 | 66 | 66 | 68 | 71 | 72 | 77 | 81 | 86 |
| Hit | 48 | 51 | 54 | 61 | 61 | 62 | 68 | 69 | 70 | 72 |
After you have put the data in the correct order, the next step is to allocate points to each of the participants. Each time a score is beaten by one of the scores in the other group, award a point to that participant. So, for example, the score of “48” is beaten by all 12 of the participants in the "smashed" group. Therefore, it is awarded a score of 12.
If the score is equal to another participant, then a half-point is awarded. So, for the value of 54, there is one participant in the smashed group that also scored 54. So, that is worth 0.5 points. And then you add the other 11 participants that scored higher than this score, for a total of 11.5.
| Smash | 7.5 | 7 | 7 | 4 | 4 | 4 | 3.5 | 1 | .5 | 0 | 0 | 0 |
| Hit | 12 | 12 | 11.5 | 9 | 9 | 9 | 5.5 | 5 | 5 | 3.5 |
Now you add up both ranks.
The sum of the ranks for the smashed group is 38.5. You will see that this is the calculation in Vassarstat for UA.
The sum of the ranks for the hit group is 81.5. This is the value of UB.
How do I know if my results are significant?
You need to use the lower of the two values to determine the significance of the data. In this case, the lower value is UA - or 38.5.
In order to determine if our results are significant, look at the following table.
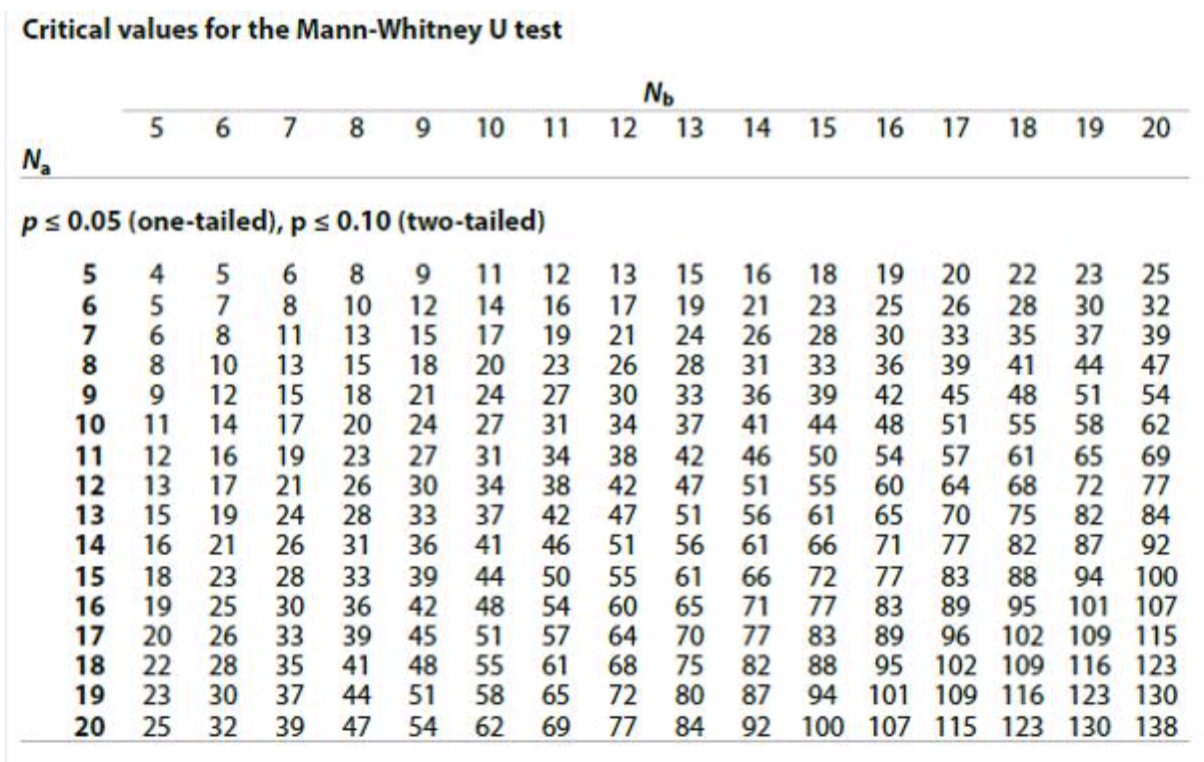
The numbers going down the left-hand column indicate the sample size of n1 (the larger group, 12). The numbers going across the top are for n2 (the smaller group, 10). For the significance level of p ≤ 0.05 for a one-tailed test, the U value must be less than 34. Since our U value is 38.5, we can say that our data is not significant.
Whether you calculate by hand or not, you would report:
A Mann-Whitney U test indicated that there was no significant difference between speed estimates for the higher intensity verb "smashed" (Mdn = 67) and for the lower intensity verb "hit" (Mdn =61.5), U = 38.5, p = 0.05.
 Twitter
 Facebook
 LinkedIn