 IB Docs (2) Team

IA marking: Sample 3
 The sample below is based on Sparrow et al's (2011) study of transactive memory.
The sample is based on a student's work, but is heavily edited and changes have been made to illustrate different facets of the IA.
The appendices do not include the letter of consent, materials, or the debriefing notes. The appendices do include the raw data and statistical calculations. Failure to include raw data or statistical calculations is penalized in the analysis.
Introduction
Nicholas Carr in 2008 wrote an article titled “Is Google Making Us Stupid?” In this article, Carr argues that having such a large pool of information at our fingertips may actually decrease one’s attention span as well as their ability to retain knowledge. Carr used anecdotes to justify his claims. This article evoked a plethora of research into the possibility that the Internet could be a detriment to our ability to learn information.
The theory proposed by Carr came to be known as the Google effect. The Google effect is defined by the phenomenon of being more likely to forget information that can be easily accessible on Google or the Internet as a whole. A study that supports the Google effect would be Sparrow et al. (2011). The aim of this study was to determine whether the Internet could be considered a transactive memory store. This experiment used a 2 by 2 independent samples design. All of the participants were to complete the task of researching 40 abstract trivia facts on Google and writing them down. The two independent conditions were whether the participants were told that they had to remember the facts and whether they were told that the data was going to be deleted. The fact that the data would be deleted has significance to the theory of transactive memory as the subjects would subsequently recall the location of the information. This meant that the experiment would test whether the knowledge of where the information was would have affected the participants’ ability to memorize the facts. This has implications in the lives of the majority of people with frequent or trivial access to the Internet. These implications are highly relevant in the lives of students or those that rely on their ability to learn information. This theory could also be connected to the concept of transactive memory. Transactive memory is a conceptual store for memory within the brain that holds the ability to locate information rather than hold the information itself. Google or the Internet could be considered a location for information. Therefore, the Google effect is supported by the theory of transactive memory.
Our aim is to test whether high school students will score differently depending on whether they believe that they will have access to their written notes on a set of facts. We are going to share documents online with the students to write their facts on in order to be able to more easily control their access to the information. The target population of international high school students allows us to test on participants who may be affected by transactive memory theory in their daily lives. Transactive memory theory if apparent in a learning environment would be detrimental to studying. This means that if the results are significant, our group could identify a possible issue within our community.
Our research hypothesis is that the group of students told that they will have access to their notes during the taking of the test will score significantly lower than the participants who were not told that they would have access to their notes.
Our null hypothesis is that the impression of whether or not the participant will have access to their information prior to taking a test will have no significant effect on the participant’s score on the test.
Exploration
Our experiment was conducted with an independent samples design. The participants were drawn through an opportunity sample from an international school. This could have affected our results because of the possibility that students struggled with English. An opportunity sample was used primarily due to convenience. This sample was convenient because the schedule of their homeroom classes allowed our group to easily carry out the experiment.
Our sample consisted of 12 students from two different homerooms, with a total of 24 students. We used two 10th grade classes and instructed the students to not speak during the experiment. This strengthened the internal validity of our experiment because it eliminated the possibility of the students discussing the facts. The fact that the students in both groups are approximately the same age and educational level means that it is very unlikely that there could be a significant difference in skills. 9 of the students were male and 15 were female. This should have no effect on our results; however, it should be noted that the group that was told that they would not have access to their notes had 3 males and 9 females while the other group had an even split of 6 males and 6 females.
Some controlled variables of our study consisted of time of day, age group, and absence of talking between participants. The time of day could be relevant as all participants would take the test in a similar state of exhaustion or fatigue due to classes. Talking is very obviously a concern because possible discussion of any of the facts could alter the results. Talking could also distract one or more students, causing them to lose focus and perform poorly on the test.
Our materials consisted of the students’ personal laptops, a single blank digital document assigned and shared with each individual student, a paper containing all 40 trivia facts for each student, and an A4 piece of paper. Additionally, we made sure that every student had a pen or pencil to write the facts with on their paper. In the original study, the researchers had the participants perform the experiment on their provided computers; however, in our study, we did not have the resources to provide 24 students with computers and therefore had them use their own computers and we shared digital documents with them to type their notes into. The A4 paper was for the students to complete the test on, in which they wrote down the facts that they had remembered.
Materials
- Student’s laptops
- Blank digital documents for each participant
- Printed copies of 40 trivia facts (see appendix 1)
- A4 papers + pens
- Informed Consent Forms
- Random number generator
Procedure
- We gave the 24 participants a letter of consent (see appendix 2)
- The participants were randomly allocated between two conditions by a random number generator.
- We gave the participants a printed list of 40 trivia facts (hard copy).
- Standardized directions were read (see appendix 3).
- The participants read the 40 trivia facts. The participants were given 10 minutes to type them into a shared digital document
- For group 1, participants believed that the computer would save what was typed (we told them that whatever they write on the document will be saved and that they will be available to use it later).
- Participants believed that everything would be erased (we told them that whatever they write on the document will be erased and that they will not be available to use it later).
- All participants were then asked to write down as many of the statements as they could remember individually on an A4 paper for 5 minutes.
- We then collected their data and debriefed the participants.
Analysis
This is a visual analysis of the quantitative data that was collected from our experiment. It was common that participants would get facts incorrect. This meant that we could only count facts in which students correctly identified key terms. Also, we did not count incomplete answers. Spelling was an issue in some cases. If a term was spelled incorrectly we judged whether it was close enough to the correct term. This could be considered a limitation as it is an attempt to quantify qualitative data.
Table 1. Descriptive analysis of data
| Group told that they would have notes | Group told that they would not have notes | |
| Mean | 43.3 | 51.7 |
| Standard deviation | 43.5 | 51 |
Graph 1. Analysis of data
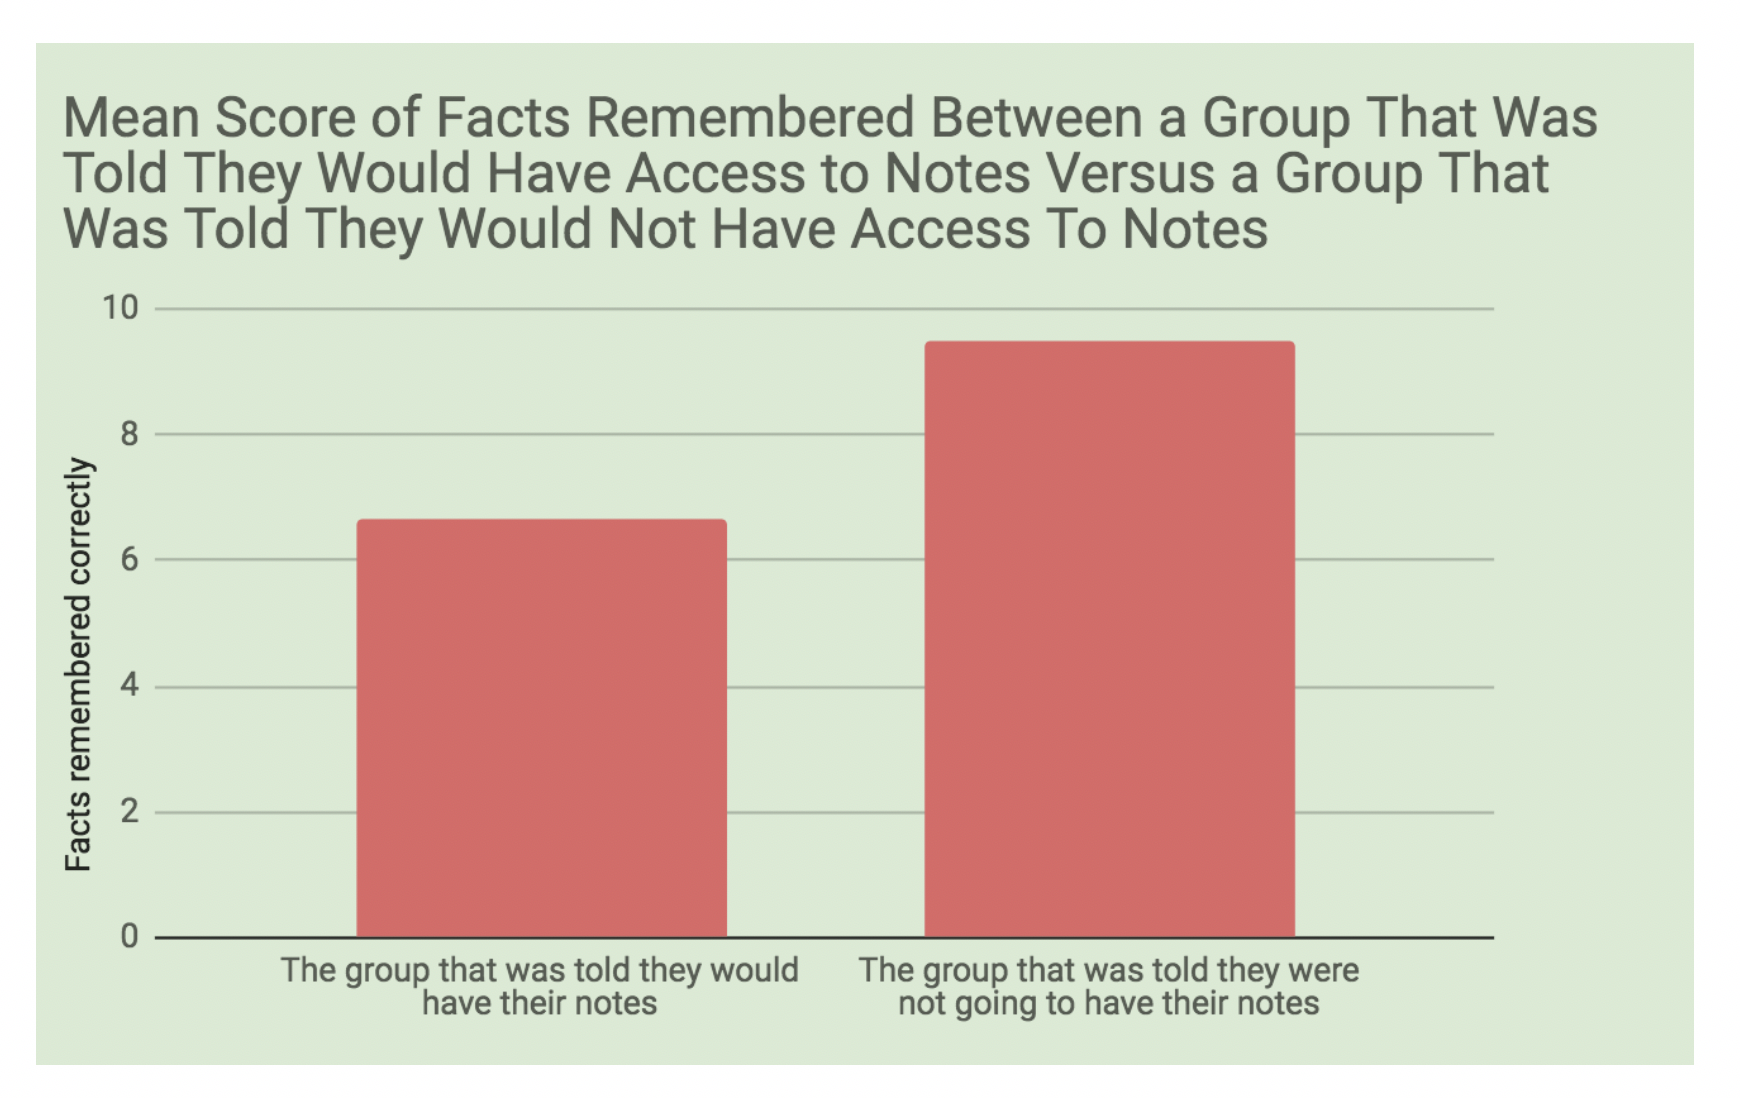
The mean of the data represents the average score for each group, and the standard deviation defines the dispersion of the data in reference to the average.
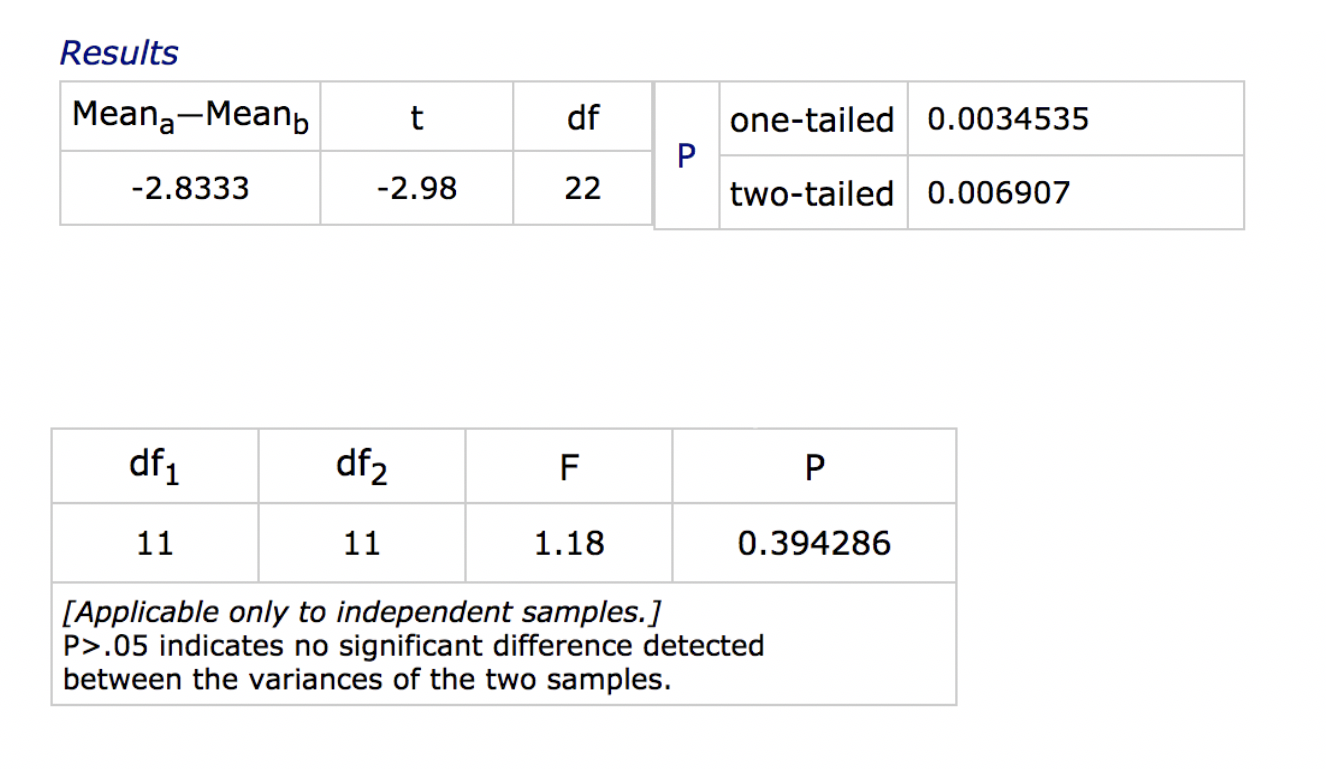
This data shows a clear difference in mean between both groups in a way that supports the original study. Therefore, this data by appearance should reject our null hypothesis. However, the F-test in order to verify the significance of the difference revealed that the data has a p-value of approximately 0.39. (0.39 > 0.05) which means that the data holds no significant difference and therefore we must retain our null hypothesis. According to our study, the fact that students know they will have access to notes has no significant effect on their ability to remember information.
Evaluation
As stated in the analysis, we were not able to reproduce the results of Sparrow et al. They were able to find a significant difference between the participants who had been told they would they would have access to their notes and those who were told they would not. This is most likely due to how we changed the time constraints from the original study.
The results of our study are not significant and therefore are not supportive of transactive memory and the Google effect. It is possible that due to flaws in our design, sample, and procedure, the students in the experimental group did not have enough of a motive to remember the location of the information, or chose not to rely on it.
Our greatest strength within the study would lie in its controlled variables. Our participants were very compliant and all seemed to attempt to complete the task correctly. This means that it is unlikely that any student had difficulty understanding the task, as also understood during the debriefing process. We believe that we had extremely limited confounding variables, therefore increasing our overall internal validity. Furthermore, we accounted for and controlled confounding variables such as talking or differences in how the researchers briefed each group. We also did well in optimizing our facts in order to not adhere to any curriculums of the classes that the students could be taking.
A limitation of our independent sample design is the age of the students. Students in the 10th grade could not understand the importance of the internal assessment and be unmotivated to perform to their greatest abilities within the experiment. If the students are unmotivated in the study, they could choose to not follow the directions or act unpredictably. This includes the possibility of students in the experimental group choosing not to rely on their notes. Furthermore, students in the control group could have not actually utilized the writing of notes to study and simply to blindly copy down as much information as possible. This could be provoked by stress caused by the short time limit.
Some limitations of our procedure include that we might not have given the students long enough time to record all of the memorized facts. This is specifically seen in the group that had been told that they would not have access to their documents afterward as 6 of the 12 students had incomplete facts written down at the bottom of their lists. This group had a slightly higher average level of facts written above the other group and they could have potentially had a higher level of fact remembered that was unrepresented.
Some limitations of our sample include that there were some students that were not as proficient in English as others and that students could inherently feel obligated to memorize information because of their academic environment. This was seen in the data from the group that was told they would have access to their documents. Two students in the group had extreme difficulty with their spelling however, we judged their intent based on intuition and presence of key terms. Regardless, these each had some facts that we were unable to pinpoint the exact intention, which could have had an effect on the data. This means that this group could have potentially had a higher level of fact remembered that was unrepresented. It is also possible that the fact that our sample was of students could mean that the participants in the experimental group would be prone to intentional or unintentional memorization of the facts.
Possible modifications to this study if one were to replicate it would include adding another group with a different number of facts or adding a reward for correct completion of the task. Adding another group where there is a different number of facts could test whether being given a larger amount of facts to remember has a significant effect on how many are remembered in a specific amount of time. Also, adding a reward for correct completion of the task like money could motivate the participants to correctly adhere to the rules.
From our study, we cannot conclude that there is a correlational relationship with being told that you will have access to data and your retrieval of the data.
Works cited
Carr, Nicholas. “Is Google Making Us Stupid?” The Atlantic, Atlantic Media Company, 13 June 2018, www.theatlantic.com/magazine/archive/2008/07/is-google-making-us-stupid/306868/.
English , Jason. “119 Amazing Facts for National Trivia Day.” Mental Floss, Mental Floss, 4 Jan. 2012, mentalfloss.com/article/29639/119-amazing-facts-national-trivia-day.
Sparrow, Betsy, et al. “Google Effects on Memory: Cognitive Consequences of Having Information at Our Fingertips.” Science, American Association for the Advancement of Science, 5 Aug. 2011, science.sciencemag.org/content/333/6043/776.full.
Ward, Alvin. “135 Amazing Facts for People Who Like Amazing Facts.” Mental Floss, Mental Floss, 7 Mar. 2018, mentalfloss.com/article/508255/amazing-facts-people-who-amazing-facts.
Appendix i. Raw data
The number of correct answers recalled from a list of 40 questions.
| Access to notes | No access to notes |
| 8 | 10 |
| 10 | 7 |
| 6 | 14 |
| 10 | 10 |
| 3 | 11 |
| 9 | 11 |
| 4 | 7 |
| 3 | 11 |
| 7 | 10 |
| 6 | 6 |
| 7 | 8 |
| 7 | 9 |
Appendix ii. Mann Whitney calculations
Assessment
Introduction (max 6 marks)
The theory on which the investigation is based is identified and there is an attempt to describe it, but it is not well focused. The link of the theory to the study is limited. (3 marks). The aim of the investigation is stated but not clear – e.g. “score differently.” The relevance is not really explained in any clear detail. (3 marks). The independent and dependent variables are correctly stated in the null or research hypotheses, but not operationalized. (3 marks). The description of the original study in the introduction detracts from the general focus.
Total: 3 marks
Exploration (max 4 marks)
The research design is identified but neither described nor explained. There is no attempt to explain why this design was used instead of a repeated measures design. (1 mark) The materials used are described. However, there is no explanation as to how and why the trivia facts were chosen. (2 marks). There is some explanation of the sampling technique, but this could be more developed (3 marks) as could the explanation of why this age level was chosen (3 marks). There is an attempt to explain the controls, but it is rather superficial (2 marks)
Total: 2 marks
Analysis (max 6 marks)
Only descriptive statistics are appropriately applied. It is unclear why an “F test” was used. An F test is only used to determine variance. (2 marks) The graph addresses the hypothesis but contains errors - for example, the full range of data was not used on the x axis. (4 marks); The statistical findings are stated but either not interpreted with regard to the data or not linked to the hypothesis. In addition, the p value is not correctly interpreted (2 marks).
Total: 2 marks
Evaluation (max 6 marks)
Strengths and limitations of the design, sample or procedure are stated but are not directly relevant to the hypothesis. There are many errors in the discussion of the study and does not clearly distinguish between the design and the procedure. (2 marks) One or more modifications are stated, but not explained. They are also rather superficial and not justified. (2 marks). The findings of the student’s investigation are described with reference to the background theory or model (3 marks).
Total: 2 marks
Total marks
Total: 10 marks
IB 4
 Twitter
 Facebook
 LinkedIn