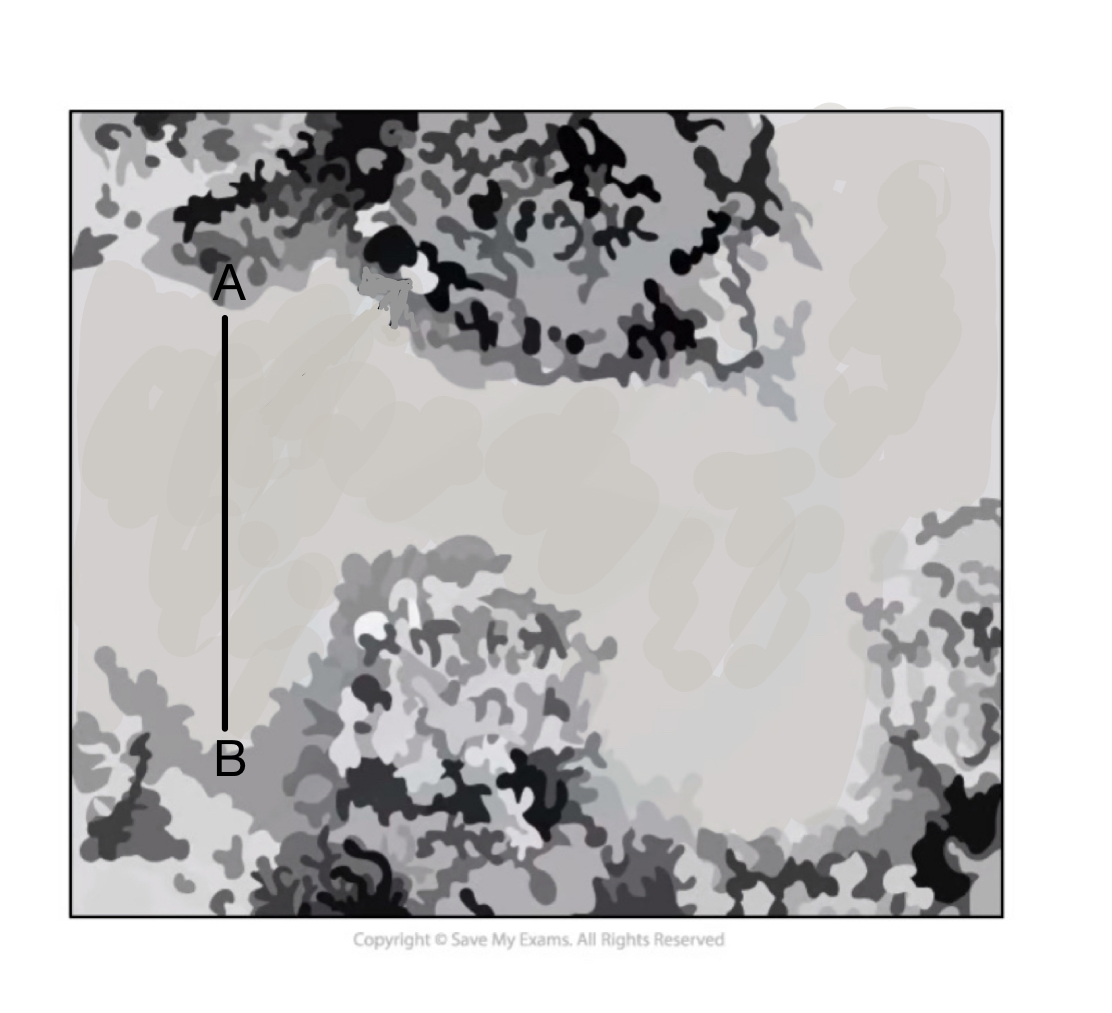
Question 1a
Question 1b

Identify the structures labelled A and B in the diagram
Question 1c

Suggest, with a reason, the effect of this on the production of ATP.
Question 1d

State the net production of ATP and reduced NAD during glycolysis.

Identify the structures labelled A and B in the diagram

Suggest, with a reason, the effect of this on the production of ATP.

State the net production of ATP and reduced NAD during glycolysis.

Identify the number of carbon atoms (e.g. 1C) at each stage of the Krebs cycle.
|
Stage of respiration |
Number of NAD molecules |
Number of FAD molecules |
|
Glycolysis |
|
|
|
Link reaction |
|
|
|
Krebs cycle |
|
|
|
Electron transport chain |
|
|
|
Chemiosmosis |
|
|

Suggest, with a reason, which part of the mitochondrion is shown in the diagram.
Electron tomography has been used to make new discoveries about mitochondria.
Describe features of the mitochondria that have been identified by the use of electron tomography.

i. Describe the process of phosphorylation of ATP.
One mark is available for clarity of communication throughout this question.