0%

DP IB Biology: HL

Topic Questions

Home / IB / Biology: HL / DP / Topic Questions / 12. Data Questions / 12.1 Data Questions (SL) / Structured Questions: Paper 2


12.1 Data Questions (SL)

Question 1a

Marks: 1
a)
Rhododendron ponticum (pictured below) is a fast-growing, non-native, invasive species currently threatening biodiversity in the UK.q1a_7-1_data_questions_medium_ib_sl_sq

                                     Rhododendron ponticum

Originally introduced from Spain as a decorative plant for gardens, R. ponticum forms large thickets and outcompetes native plants such as bryophytes, other woody plants and wildflowers. Particularly severely affected are Atlantic oak woodland areas of coastal land in the western United Kingdom. Clearance programmes to remove R. ponticum have been in place for approximately 30 years in that region. Data was gathered on how the removal of R. ponitcum allows for affected sites to recover and for native species to be restored.

            A quadrat study was carried out at three sites:

  • An area of dense Rhododendron ponticum thickets
  • An area of intermediate ponticum coverage
  • An area of uninvaded land as a control

In each study, the number of species in each area's understorey was counted, as well as the % vegetation cover. This data is shown on the graphs below, which have been plotted with a line of best fit.

q1a_1_7-1_data_questions_medium_ib_sl_sqq1a_2_7-1_data_questions_medium_ib_sl_sq

Calculate the range of species found at a R. ponticum density of 2 log arbitrary units.

    Assess your score
      

    Question 1b

    Marks: 1
    b)
    State how the % vegetation cover can exceed 100% in a given area.
      Assess your score
        

      Question 1c

      Marks: 1
      c)
      Suggest why a log scale is used to show the density of R. ponticum in the graphs.
        Assess your score
          

        Question 1d

        Marks: 1
        d)
        Explain the decline in the number of species found as the density of R. ponticum increases, as found in this study.
          Assess your score
            

          Question 1e

          Marks: 2
          e)
          Suggest two ways in which R. ponticum could affect competition.
            Assess your score
              

            Question 1f

            Marks: 1
            f)
            In an extension of this study, the spread of epiphytes (plants that grow on other plants, but not parasitically) was examined as a function of the time elapsed since the human clearance of R. ponticum from an area of ancient woodland. Typical taxa of epiphytes include mosses and liverworts. This was done to estimate how well a woodland habitat could recover from an invasion by R. ponticum. One theory is that R. ponticum can affect successive species long after all its biomass has been cleared away from a site. The results are shown in the diagram below.q1f_7-1_data_questions_medium_ib_sl_sqq1f_1_7-1_data_questions_medium_ib_sl_sq

            Estimate the number of years before the number of species found on cleared land first exceeded the number of species found in uninvaded woodland.

              Assess your score
                

              Question 1g

              Marks: 3
              g)
              (i) Discuss whether the clearance of a R. ponticum invasion has an impact on the recovery of the woodland habitat.

                 (ii) Suggest a reason for any impact observed.

                Assess your score
                  

                Question 1h

                Marks: 3
                h)
                In a further study, a series of measured soil core samples were taken from thirty sites within the Atlantic woodland
                • 10 sites uninvaded by R. ponticum
                • 10 sites cleared of R. ponticum more than 10 years previously
                • 10 sites of dense R. ponticum coverage         
                The seeds contained within those samples were germinated in a laboratory greenhouse to display which species were present as ungerminated seeds in the soils. The study ran for 20 weeks. Control trays containing sterile compost showed negligible seedling growth.         
                The table below shows a summary of the results obtained.   q1h-7-1-medium-sq-ib-biology-sl-1
                (i)         Identify the species that was sampled on the fewest sites when the R. ponticum growth was densest. 
                (ii)        Explain what this data shows for the prospects of growth of broadleaf carpet grass (Axonopus compressus) on  cleared land following an R. ponticum invasion.
                  Assess your score
                    

                  Question 1i

                  Marks: 2
                  i)
                  Using the data in part (h), identify, with a reason, the species that benefited most from the clearance of R. ponticum from Atlantic coastal woodland. 
                    Assess your score
                      

                    Question 2a

                    Marks: 1
                    a)
                    Agriculturalists in Mozambique investigated the optimum planting conditions for sweet potato plants. Sweet potato (Ipomoea batatas) is a popular root crop, with increasing use as a staple vegetable. Variables under investigation were the spacing of seed sowing and the optimum use of fertilisers to achieve a maximum yield.
                    Plant spacing (16, 20 and 25 cm between plants) was combined with three nitrogen addition rates of 30, 35 and 40 grams per square metre (gm-2) in separate test plots of area 1.5m2. The source of nitrogen used in the study was urea (CH4N2O). Other growing conditions were kept constant, to determine the optimal combination of spacing and nitrogen addition.
                    The study ran for 175 days after planting individual I. batatas seeds in the respective conditions. The results of the study are summarised in the table below.
                    0MX0j8yr_q2a-7-1-medium-sq-ib-biology-sl-1

                    Identify the growth conditions that gave the most favourable yield of sweet potatoes in this study.


                      Assess your score
                        

                      Question 2b

                      Marks: 1
                      b)
                      Describe the relationship between the mean underground dry mass of the crop and the mean crop yield of sweet potatoes in this study.
                        Assess your score
                          

                        Question 2c

                        Marks: 1
                        c)
                        Suggest, with a reason, why underground dry mass is used as an indicator of crop yield in this study. 
                          Assess your score
                            

                          Question 2d

                          Marks: 3
                          d)
                          Compare and contrast the effects of increasing spacing and increasing urea addition, in terms of underground dry mass and crop yields. 
                            Assess your score
                              

                            Question 2e

                            Marks: 2
                            e)
                            Suggest, with a reason, why the choice of units of crop yield quoted in this study (tonnes per hectare) was not an appropriate one.
                              Assess your score
                                

                              Question 2f

                              Marks: 4
                              f)
                              In another part of this investigation, the mass of plant matter above ground (both fresh mass and dry mass) was measured against leaf length and crop yield for the three levels of urea concentration previously tested. All these data were gathered from sweet potato plants spaced at 20cm distance. The results are shown in the graph below.
                              q2f_7-1_data_questions_medium_ib_sl_sq

                              The scientists concluded that a planting regime of plants spaced 20cm apart with an addition of urea more than 35 gm-2 should be recommended to farmers. Evaluate the scientists' conclusion, using the data above and from part a).
                                Assess your score
                                  

                                Question 3a

                                Marks: 1
                                a)

                                EDTA is a compound that reacts with metal ions to form a stable harmless compound. It is commonly used to reduce levels of calcium in many medical procedures including dental work. EDTA has also been shown to have antimicrobial properties effective in the treatment of Staphylococcus aureus bacteria. 

                                Scientists wanted to establish how effective EDTA could be in the treatment of infections from Escherichia coli bacteria. The growth of E.coli bacteria was monitored in response to treatment with EDTA over a period of 5 days. The chart below shows the results.

                                q3a_7-1_data_questions_medium_ib_sl_sq

                                State the reason for the group treated with no EDTA.

                                  Assess your score
                                    

                                  Question 3b

                                  Marks: 1
                                  b)

                                  Calculate the percentage difference between the number of bacteria in the sample treated with EDTA and the number of bacteria in the untreated sample after 5 days.

                                    Assess your score
                                      

                                    Question 3c

                                    Marks: 2
                                    c)
                                    Outline the effect of EDTA on the growth of bacteria.
                                      Assess your score
                                        

                                      Question 3d

                                      Marks: 1
                                      d)
                                      The presence of antibiotic resistance within E.coli populations was studied and presented in the graph below.
                                      q3d_7-1_data_questions_medium_ib_sl_sq

                                       Identify which antibiotic has been shown to be the least effective against E.coli.

                                        Assess your score
                                          

                                        Question 3e

                                        Marks: 2
                                        e)
                                        Compare the levels of antibiotic resistance shown in E.coli to the antibiotics studied.
                                          Assess your score
                                            

                                          Question 3f

                                          Marks: 3
                                          f)
                                          The table below shows some of the side effects associated with the antibiotics studied.

                                          Antibiotic

                                          Side effects

                                          EDTA

                                          Abdominal cramps, nausea, vomiting, diarrhoea, headache, low blood pressure, skin problems and fever.

                                          Amoxicillin

                                          Abdominal cramps, back and leg pains, bloating, blood in urine, chest pains

                                          Tetracycline

                                          Nausea, vomiting, diarrhoea, loss of appetite, mouth sores, black hairy tongue, sore throat, headache

                                          Pivmecillinam hydrochloride

                                          Diarrhoea, feeling sick, thrush

                                          Using all the information provided, evaluate whether EDTA is the best candidate antibiotic to treat E.coli.

                                            Assess your score
                                              

                                            Question 3g

                                            Marks: 2
                                            g)
                                            Suggest two different methods that could be used to help reduce the development of antibiotic resistance.
                                              Assess your score
                                                

                                              Question 4a

                                              Marks: 1
                                              a)

                                              In trained athletes, the metabolism of lactate can occur at a fast enough rate to reduce the build-up of lactic acid. As a result, trained athletes are able to maintain a lower lactate level even during periods when their heart rate is very high, compared to an untrained individual. A study was done to compare the blood lactate levels to the heart rate of 5 individuals during exercise.

                                              Individual

                                              Blood Lactate /

                                              mol per L

                                              Average VE /

                                              L per min

                                              Heart Rate / min-1

                                              1

                                              1.8

                                              60.1

                                              156

                                              2

                                              2.8

                                              83.1

                                              163

                                              3

                                              4.9

                                              79.8

                                              148

                                              4

                                              5.0

                                              88.9

                                              152

                                              5

                                              9.5

                                              148.0

                                              184

                                              If training allows an individual to maintain a low blood lactate level compared to heart rate, identify which is the most highly trained individual from the study.

                                                Assess your score
                                                  

                                                Question 4b

                                                Marks: 2
                                                b)
                                                Maximum minute ventilation (VE) is a measure of the maximum total volume of gas inhaled or exhaled per minute (measured in L/min). During exercise, VE changes to accommodate changes in metabolic requirements, this variability around VE is called VE variability and is measured in mL/min. Both VE and VE variability can be used as indicators of fitness
                                                The graphs below show the differences in VE variability and maximum VE from a study of trained and untrained individuals.q4b_7-1_data_questions_medium_ib_sl_sq

                                                Describe the relationship between training, maximum VE and VE variability.
                                                  Assess your score
                                                    

                                                  Question 4c

                                                  Marks: 3
                                                  c)
                                                  Using the information provided, discuss the statement that individual 3 and individual 4 are both equally as fit.
                                                    Assess your score
                                                      

                                                    Question 4d

                                                    Marks: 2
                                                    d)
                                                    A study was done to show how the expression of a gene associated with lactate metabolism would influence exercise performance. Mice were genetically modified (GM) by inserting a gene responsible for the synthesis of a protein involved in lactate metabolism, protein X.
                                                    Lactate levels in the two groups of mice were monitored throughout a period of exercise.
                                                    q4d_7-1_data_questions_medium_ib_sl_sq

                                                    Compare the lactate levels of the control group to the GM group.

                                                      Assess your score
                                                        

                                                      Question 4e

                                                      Marks: 3
                                                      e)
                                                      High levels of lactic acid is a characteristic symptom in individuals suffering from diabetes. It can lead to more serious and potentially life-threatening issues such as lactic acidosis. Scientists suggested that protein X could be used as a treatment for high lactate levels in diabetics.
                                                       
                                                      Using the information provided, evaluate whether there is enough evidence to support the use of protein X in the treatment of diabetes.
                                                        Assess your score
                                                          

                                                        Question 4f

                                                        Marks: 2
                                                        f)
                                                        During exercise, VE increases as a mechanism to reduce the risk of lactic acidosis (high levels of lactic acid).
                                                        Suggest how this increase in VE may prevent lactic acidosis.
                                                          Assess your score
                                                            

                                                          Question 5a

                                                          Marks: 1
                                                          a)
                                                          Net primary productivity (NPP) is a measure of the amount of carbon stored as biomass by primary producers. NPP is calculated using the total amount of carbon that the plant fixes during photosynthesis, minus the total amount of carbon lost during respiration. Different ecosystems have different levels of productivity based on abiotic and biotic factors of the environment. The cycling of nutrients in the ecosystem determines the  nutrients available to the plants for growth and therefore has a direct impact on the NPP of that ecosystem.
                                                          The table below shows the differences in decomposition cycles for six vital nutrients across three different biomes. A calculation has also been done to show the NPP of each biome.
                                                          q5a-7-1-medium-sq-ib-biology-sl-1

                                                          Identify which biome shows the slowest rate of decomposition for the nutrients.

                                                            Assess your score
                                                              

                                                            Question 5b

                                                            Marks: 1
                                                            b)
                                                            Suggest a biotic factor which may impact the decomposition rates generated in an ecosystem.
                                                              Assess your score
                                                                

                                                              Question 5c

                                                              Marks: 1
                                                              c)
                                                              List two carbon-containing compounds found in plants.
                                                                Assess your score
                                                                  

                                                                Question 5d

                                                                Marks: 2
                                                                d)
                                                                With reference to the data in part (a), outline the differences between the rates of nitrogen cycling in all three forests.
                                                                  Assess your score
                                                                    

                                                                  Question 5e

                                                                  Marks: 2
                                                                  e)
                                                                  Describe the relationship between net primary productivity (NPP) and decomposition rate for the three biomes.
                                                                    Assess your score
                                                                      

                                                                    Question 5f

                                                                    Marks: 1
                                                                    f)
                                                                    A study was conducted to establish the relationship between different abiotic factors and the rate of decomposition in a Mediterranean forest ecosystem. The data can be seen in the graph below.
                                                                    q5f_7-1_data_questions_medium_ib_sl_sq

                                                                    Identify which abiotic factor produced the biggest change in the rate of decomposition.

                                                                      Assess your score
                                                                        

                                                                      Question 5g

                                                                      Marks: 3
                                                                      g)
                                                                      Using the data given in part (f), compare the effects of the different abiotic factors on decomposition.
                                                                        Assess your score
                                                                          

                                                                        Question 5h

                                                                        Marks: 2
                                                                        h)
                                                                        Suggest the reason for the trend shown in decomposition as a result of temperature change.
                                                                          Assess your score
                                                                            

                                                                          Question 5i

                                                                          Marks: 2
                                                                          i)
                                                                          Using the data provided, deduce why tropical rainforests have the highest rate of productivity of the three biomes studied.
                                                                            Assess your score
                                                                              

                                                                            Question 6a

                                                                            Marks: 1
                                                                            a)
                                                                            Grey seals (Halichoerus grypus) are found in coastal waters around northern Europe and North America. Their diet consists of a variety of fish species, crustaceans, and molluscs, and they are known to dive for periods of up to 45 minutes while searching for food.

                                                                            The graph below shows the blood flow to various organs in the body of a grey seal while they are either searching for food at the water’s surface (i.e. not during a dive), or actively chasing prey, also at the water’s surface.

                                                                            q6a_7-1_data_questions_medium_ib_sl_sq

                                                                            Estimate the difference in blood flow to the heart when the seal is searching for food compared to when it is actively chasing prey.

                                                                              Assess your score
                                                                                

                                                                              Question 6b

                                                                              Marks: 2
                                                                              b)
                                                                              Using the graph in part (a), distinguish between the blood flow when the seal is searching for food and when it is actively chasing prey between the kidneys, flipper muscles, and brain.
                                                                                Assess your score
                                                                                  

                                                                                Question 6c

                                                                                Marks: 3
                                                                                c)
                                                                                Suggest why blood flow to the seal’s organs is different when the seal is searching for food compared to when it is actively chasing prey.
                                                                                  Assess your score
                                                                                    

                                                                                  Question 6d

                                                                                  Marks: 1
                                                                                  d)
                                                                                  State the property of arterioles that enables blood flow to the organs to be regulated.
                                                                                    Assess your score
                                                                                      

                                                                                    Question 6e

                                                                                    Marks: 1
                                                                                    e)
                                                                                    Another grey seal’s heart rate was measured before, during, and after a feeding dive.
                                                                                    The results are shown in the graph below.
                                                                                    q6e_7-1_data_questions_medium_ib_sl_sq

                                                                                    Calculate the difference between the seal’s minimum and maximum heart rate throughout the monitoring period.


                                                                                      Assess your score
                                                                                        

                                                                                      Question 6f

                                                                                      Marks: 2
                                                                                      f)
                                                                                      Describe the changes in heart rate throughout the monitoring period shown in part (e).
                                                                                        Assess your score
                                                                                          

                                                                                        Question 6g

                                                                                        Marks: 2
                                                                                        g)
                                                                                        Suggest how the heart rate changes shown in part (e) might affect the seal’s body during a dive.
                                                                                          Assess your score
                                                                                            

                                                                                          Question 6h

                                                                                          Marks: 2
                                                                                          h)
                                                                                          Deduce, with reference to both graphs, what would happen to the volume of blood passing through the flippers during a dive.
                                                                                            Assess your score
                                                                                              

                                                                                            Question 7a

                                                                                            Marks: 1
                                                                                            a)
                                                                                            Disease X is a potentially fatal disease found in sea urchins, with symptoms such as body deflation, body lesions, and discoloration. The cause of disease X has yet to be determined, and several hypotheses have been tested.
                                                                                             
                                                                                            One such study investigated the possible connection between the presence of viruses known as densoviruses and disease X in several species of sea urchin.
                                                                                             
                                                                                            Some of the results of the study are shown in the graph below.

                                                                                            q7a_7-1_data_questions_medium_ib_sl_sq


                                                                                               State the viral load of species 2 when symptoms are present.

                                                                                              Assess your score
                                                                                                

                                                                                              Question 7b

                                                                                              Marks: 2
                                                                                              b)
                                                                                              Compare and contrast the relationship between viral load and disease X symptoms in the different species studied.
                                                                                                Assess your score
                                                                                                  

                                                                                                Question 7c

                                                                                                Marks: 2
                                                                                                c)
                                                                                                Use the graph in part (a) to deduce the impact of densoviruses on disease X.
                                                                                                  Assess your score
                                                                                                    

                                                                                                  Question 7d

                                                                                                  Marks: 2
                                                                                                  d)
                                                                                                  Aquatic organisms have a thin layer of water surrounding their bodies known as the diffusive boundary layer (DBL). Organisms exchange substances with their environment via this layer, and its composition is different to that of the surrounding seawater.
                                                                                                   
                                                                                                  Another study looked at the impact of the composition of the DBL on the development of disease X.  Two types of organic matter were added to the water surrounding sea urchins of species 2:

                                                                                                  • Organic matter in the form of lab-grown algae.
                                                                                                  • Seawater containing normal levels of organic matter. 

                                                                                                  The sea urchins were assessed over 10 days for signs of disease X lesions and the water in the DBL was tested for bacteria. Note that the control contained no additional organic matter.
                                                                                                  q7d_7-1_data_questions_medium_ib_sl_sq

                                                                                                  Describe the formation of disease X lesions over the testing period.

                                                                                                    Assess your score
                                                                                                      

                                                                                                    Question 7e

                                                                                                    Marks: 2
                                                                                                    e)
                                                                                                    Discuss any observations on the growth of disease X lesions and the abundance of bacteria in the DBL shown in part (d).
                                                                                                      Assess your score
                                                                                                        

                                                                                                      Question 7f

                                                                                                      Marks: 1
                                                                                                      f)
                                                                                                      As part of the same study, the researchers looked at the impact of reduced oxygen levels in the DBL on lesion growth in a fourth species of sea urchin.
                                                                                                       
                                                                                                      Their results are shown in the graph below.

                                                                                                      q7f_7-1_data_questions_medium_ib_sl_sq

                                                                                                      Calculate the number of individuals that would have lesions after 10 days with depleted oxygen levels in a population of 23.
                                                                                                        Assess your score
                                                                                                          

                                                                                                        Question 7g

                                                                                                        Marks: 2
                                                                                                        g)
                                                                                                        Suggest how depleted oxygen might lead to the increase in growth of disease X lesions shown in part (f).
                                                                                                          Assess your score
                                                                                                            

                                                                                                          Question 7h

                                                                                                          Marks: 3
                                                                                                          h)
                                                                                                          A student read the results described in parts (d) and (f) and concluded that disease X is caused by an increase in organic matter and a decrease in oxygen levels in the DBL of sea urchins.

                                                                                                                    Evaluate the student’s conclusion.

                                                                                                            Assess your score
                                                                                                              

                                                                                                            Question 8a

                                                                                                            Marks: 1
                                                                                                            a)
                                                                                                            Plant species living in dry climates need to preserve water and often have adaptations that helps them to do this.

                                                                                                            Scientists are interested in discovering crop varieties that have water-saving adaptations; one study looked at the effect of dry conditions on several varieties of wheat.

                                                                                                            The researchers measured the water content of four varieties of wheat (v1, v2, v3, and v4) at the end of a 10 day period without water; their results are shown in the graph below.

                                                                                                            q8a_7-1_data_questions_medium_ib_sl_sq
                                                                                                            Calculate the difference in water content between the control and dry conditions for variety 2.
                                                                                                              Assess your score
                                                                                                                

                                                                                                              Question 8b

                                                                                                              Marks: 2
                                                                                                              b)
                                                                                                              Compare and contrast the water content in control and dry conditions for the different varieties of wheat shown in part (a).
                                                                                                                Assess your score
                                                                                                                  

                                                                                                                Question 8c

                                                                                                                Marks: 2
                                                                                                                c)
                                                                                                                The image below shows the effect of 10 days without water on the four varieties of wheat.
                                                                                                                q8c_7-1_data_questions_medium_ib_sl_sq

                                                                                                                Outline the effect of 10 days without water on wheat varieties 1-4.

                                                                                                                  Assess your score
                                                                                                                    

                                                                                                                  Question 8d

                                                                                                                  Marks: 1
                                                                                                                  d)
                                                                                                                  Suggest why dry conditions lead to the impacts seen in part (c).
                                                                                                                    Assess your score
                                                                                                                      

                                                                                                                    Question 8e

                                                                                                                    Marks: 2
                                                                                                                    e)
                                                                                                                    The scientists also analysed the potassium ion (K+) content of the tissues of each variety after the 10 day experiment period. The results of this analysis are shown in the graph below.
                                                                                                                    q8e_7-1_data_questions_medium_ib_sl_sq
                                                                                                                    Describe the impact of dry conditions on the potassium ion content of the different varieties.
                                                                                                                      Assess your score
                                                                                                                        

                                                                                                                      Question 8f

                                                                                                                      Marks: 3
                                                                                                                      f)
                                                                                                                      With reference to the results shown in parts (a), (c), and (e):

                                                                                                                      i.       Deduce the effect of potassium ion content on the response of wheat to dry conditions.
                                                                                                                         
                                                                                                                      ii.      Suggest how some wheat varieties are able to minimise the impact of dry conditions.
                                                                                                                        Assess your score
                                                                                                                          

                                                                                                                        Question 8g

                                                                                                                        Marks: 3
                                                                                                                        g)
                                                                                                                        After reading the results shown in parts (a), (c), and (e), a farming organisation recommended that variety 4 should be planted by farmers in parts of the world where drought is common.  Evaluate this recommendation.
                                                                                                                          Assess your score
                                                                                                                            

                                                                                                                          Question 9a

                                                                                                                          Marks: 1
                                                                                                                          a)
                                                                                                                          Bananas with less starch and more sugar are sweeter. This is advantageous in several ways, including the taste of the bananas and the time taken for them to ripen.
                                                                                                                          In a particular strain of bacteria, scientists found an enzyme that decreases the production of starch. The gene for this enzyme was transferred to bananas using genetic engineering to decrease the banana’s starch content, resulting in transgenic bananas. The gene was transferred to three banana varieties to create three transgenic lines. The table shows the mean amount of starch and sugar contained in three lines of normal bananas (control) and three lines of transgenic bananas.
                                                                                                                          q9a-7-1-medium-sq-ib-biology-sl-1

                                                                                                                          i.  Identify which line of transgenic bananas has the greatest amount of sugar.

                                                                                                                          ii. Calculate the difference in the mean percentage of starch in control and transgenic bananas.

                                                                                                                            Assess your score
                                                                                                                              

                                                                                                                            Question 9b

                                                                                                                            Marks: 4

                                                                                                                            b)
                                                                                                                            i)       Compare the levels of carbohydrate between the transgenic lines of bananas and the control lines of bananas. 

                                                                                                                                     ii)        Suggest reasons for these differences.


                                                                                                                              Assess your score
                                                                                                                                

                                                                                                                              Question 9c

                                                                                                                              Marks: 2
                                                                                                                              c)
                                                                                                                              Bananas were harvested from trees and stored. Sample bananas were removed from storage after 2, 4, 6 or 8 days. The colour of the bananas was then measured and value reported using a 0-8 rating (pale yellow through to dark green), where a score of 4 or lower indicates acceptable ripeness for selling. The results are shown in the bar chart.
                                                                                                                              q9c_7-1_data_questions_medium_ib_sl_sq
                                                                                                                              Describe the effect of transferring the bacterial gene on the suitability of the transgenic bananas for selling, compared to control bananas.
                                                                                                                                Assess your score
                                                                                                                                  

                                                                                                                                Question 9d

                                                                                                                                Marks: 2
                                                                                                                                d)
                                                                                                                                An important part of storage management is to delay the formation of brown or black spots on the skin of bananas. A second sample of bananas was harvested and stored. Bananas were removed from storage on day 8. They were then examined and the number of brown or black spots present was recorded. The mean number of spots is indicated in the graph for control lines (C1, C2 and C3) and transgenic lines (T1, T2 and T3) of bananas.

                                                                                                                                q9d_7-1_data_questions_medium_ib_sl_sq

                                                                                                                                Deduce how the bacterial gene affects the storage of bananas.

                                                                                                                                  Assess your score
                                                                                                                                    

                                                                                                                                  Question 9e

                                                                                                                                  Marks: 2
                                                                                                                                  e)
                                                                                                                                  Some people argue that these genetically modified bananas could have harmful effects. Discuss two possible harmful effects of GM crops.
                                                                                                                                    Assess your score
                                                                                                                                      

                                                                                                                                    Question 10a

                                                                                                                                    Marks: 1
                                                                                                                                    a)
                                                                                                                                    Artificial floating islands are man-made rafts or platforms that can be introduced to bodies of water to increase existing habitat for a variety of organisms, including invertebrates, amphibians and birds.
                                                                                                                                     
                                                                                                                                    As artificial floating islands have been increasingly introduced to ponds and lakes in parks in London, ecologists have studied how many rafts there are available and how many of these are actually being used as nesting sites by birds. In particular, they have monitored the proportion of rafts that are being used by common moorhens (Gallinula chloropus). Data was collected halfway through each year.

                                                                                                                                    q10a_7-1_data_questions_medium_ib_sl_sq

                                                                                                                                    The number of rafts used by Gallinula chloropus changes each year. State the year in which the proportion of available rafts being used by G.chloropus was greatest.
                                                                                                                                      Assess your score
                                                                                                                                        

                                                                                                                                      Question 10b

                                                                                                                                      Marks: 1
                                                                                                                                      b)
                                                                                                                                      Calculate how many rafts were introduced to ponds and lakes from mid-2011 to mid-2012.

                                                                                                                                        Assess your score
                                                                                                                                          

                                                                                                                                        Question 10c

                                                                                                                                        Marks: 2
                                                                                                                                        c)
                                                                                                                                        Describe the relationship between the number of rafts available and the number of rafts being used.
                                                                                                                                          Assess your score
                                                                                                                                            

                                                                                                                                          Question 10d

                                                                                                                                          Marks: 3
                                                                                                                                          d)
                                                                                                                                          Foxes, badgers and cats are all known to predate on G.chloropus chicks. An ecologist conducted an investigation to see if using ultrasonic repellers (usually used to deter and repel cats) could reduce the numbers of these predators visiting a pond where G.chloropus were known to be nesting.
                                                                                                                                          q10d_7-1_data_questions_medium_ib_sl_sq

                                                                                                                                          Compare the relationship between the number of visits to the pond and the use of ultrasonic repellers for the three different predators.
                                                                                                                                            Assess your score
                                                                                                                                              

                                                                                                                                            Question 10e

                                                                                                                                            Marks: 1
                                                                                                                                            e)
                                                                                                                                            Over the same time period and for the same ponds and lakes in London that were studied in part (a), the ecologists monitored G.chloropus nests located on the banks of the ponds and lakes and on floating rafts in the centre of those ponds or lakes. Many of the ponds and lakes had ultrasonic repellers placed on their banks over the study period. Every two years, the ecologists measured the average number of chick that survived per nest.

                                                                                                                                            q10e_7-1_data_questions_medium_ib_sl_sq

                                                                                                                                            Suggest why data on chick survival rates for nests on rafts were only collected from 2008 onwards.
                                                                                                                                              Assess your score
                                                                                                                                                

                                                                                                                                              Question 10f

                                                                                                                                              Marks: 2
                                                                                                                                              f)
                                                                                                                                              Compare chick survival rates for nests on banks of ponds or lakes with chick survival rates for nests on rafts.


                                                                                                                                                Assess your score
                                                                                                                                                  

                                                                                                                                                Question 10g

                                                                                                                                                Marks: 2
                                                                                                                                                g)
                                                                                                                                                For the ponds and lakes in question (e), deduce how nest location affects chick survival.
                                                                                                                                                  Assess your score
                                                                                                                                                    

                                                                                                                                                  Question 11a

                                                                                                                                                  Marks: 3

                                                                                                                                                  a)
                                                                                                                                                  Goat (Capra hircus) livestock are the main animal grazed in northern Africa. An increase in demand for meat has resulted in more intensive farming which has increased the degradation of rangelands. To reduce the impact of grazing, farmers have been supplementing the grazing with additional feed resources, however these have proved costly and are difficult to source.
                                                                                                                                                   
                                                                                                                                                  A study was conducted to determine whether the additional feed resources affected the ability of the goats to digest their feed. The feed resources chosen - olive cake and cactus cladodes were cheaper to source and enabled a broader diet for the goats.
                                                                                                                                                   
                                                                                                                                                  For three months 44 goat kids were fed one of the following diets twice a day:
                                                                                                                                                  • Control - C (oat, barley - an energy source and faba bean - a nitrogen source)
                                                                                                                                                  • Olive Cake - OC (oat, pressed olive concentrate and faba bean)
                                                                                                                                                  • Cactus Cladodes - CC (oat, ground cactus stem concentrate and faba bean)
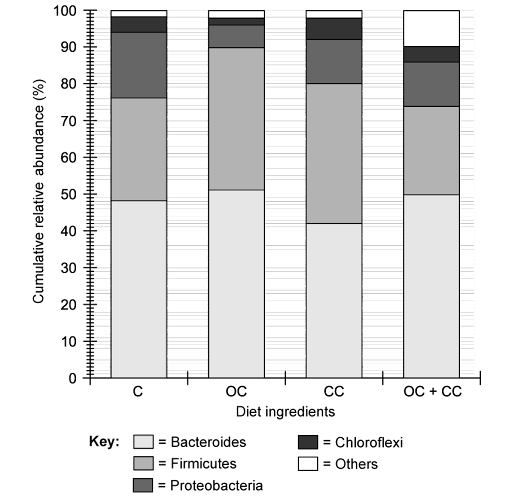
                                                                                                                                                  • Olive cake + Cactus cladodes - OC+CC (oat, olive concentrate, cactus concentrate and faba bean)
                                                                                                                                                      Table 1.0 Diet and chemical composition of the goat kids’ diet

                                                                                                                                                  q11a-7-1-medium-sq-ib-biology-sl-1

                                                                                                                                                               Percentage of diet ingredients for each diet fed to the goats

                                                                                                                                                  N_z7JTPF_q11a_7-1_data_questions_medium_ib_sl_sq


                                                                                                                                                  i)          Calculate the percentage for each diet ingredient in the Olive Cake + Cactus Cladodes diet and complete the above chart.         
                                                                                                                                                  ii)         Identify which diet/s contain the highest source of nitrogen.
                                                                                                                                                    Assess your score
                                                                                                                                                      

                                                                                                                                                    Question 11b

                                                                                                                                                    Marks: 3
                                                                                                                                                    b)
                                                                                                                                                    At the end of three months rumen (digestive system) juices and muscle samples were taken. DNA was extracted from the rumen to establish the abundance of the key digestive microbial phyla for each diet.
                                                                                                                                                    q11a_7-1_data-questions_ib_sl_sq_medium

                                                                                                                                                    i)   Determine which diet has the lowest relative abundance of the Proteobacteria phyla.

                                                                                                                                                    ii)   Analyse the effect of diet on the abundance of the key microbial phyla.


                                                                                                                                                      Assess your score
                                                                                                                                                        

                                                                                                                                                      Question 11c

                                                                                                                                                      Marks: 3
                                                                                                                                                      c)
                                                                                                                                                      The pH was also measured for each feed.

                                                                                                                                                      q11c_7-1_data_questions_medium_ib_sl_sq
                                                                                                                                                      i)          State the significance of the statement: * are significantly different at p < 0.05.

                                                                                                                                                      ii)         Compare the effect of the different diets on the digestive system pH.
                                                                                                                                                        Assess your score
                                                                                                                                                          

                                                                                                                                                        Question 11d

                                                                                                                                                        Marks: 2
                                                                                                                                                        d)
                                                                                                                                                        Suggest how the pH could affect the digestion of the different diets.
                                                                                                                                                          Assess your score
                                                                                                                                                            

                                                                                                                                                          Question 11e

                                                                                                                                                          Marks: 2
                                                                                                                                                          e)
                                                                                                                                                          Evaluate the hypothesis, using the data, that the microbial ecosystem digestibility is not increased by the additional feeding resources.          
                                                                                                                                                            Assess your score
                                                                                                                                                              

                                                                                                                                                            Question 12a

                                                                                                                                                            Marks: 1
                                                                                                                                                            a)
                                                                                                                                                            The Helicoverpa punctigera (native budworm) caterpillar is a major insect pest for Cicer arietinum (chickpeas). Reduction to crop yield and seed quality occurs when the larvae density reaches 10 to 20 per m2. The larvae primarily cause damage to the leaf surface area, flower buds and fruiting bodies and are classified into 4 instars (sizes); very small (VS) - 1 to 2 mm, small (S) - 4 to 7 mm, medium large (ML) - 8 to 23 mm and large (L) - 24 to 30+ mm. The smaller instars prefer foliage, however it is the larger instars (greater than 8 mm), who prefer the pods, that cause the most economical damage. Farmers regularly monitor their arietinum crop to determine when insecticides are required to control the H.punctigera.
                                                                                                                                                             
                                                                                                                                                            The monitoring involves beating the plants to determine the mean number of larvae per metre row and making observations of the type of damage.
                                                                                                                                                            q12a_7-1_data_questions_medium_ib_sl_sq 

                                                                                                                                                            Identify the feeding site on the C.arietinum that has the least percentage of feeding by larvae smaller than 8 mm.
                                                                                                                                                              Assess your score
                                                                                                                                                                

                                                                                                                                                              Question 12b

                                                                                                                                                              Marks: 1
                                                                                                                                                              b)
                                                                                                                                                              Calculate the difference between the percentage of feeding by larvae less than and greater than 8 mm, on C.arietinum leaves.
                                                                                                                                                                Assess your score
                                                                                                                                                                  

                                                                                                                                                                Question 12c

                                                                                                                                                                Marks: 1
                                                                                                                                                                c)
                                                                                                                                                                Suggest a reason for the preference of the small larvae feeding on the leaves.
                                                                                                                                                                  Assess your score
                                                                                                                                                                    

                                                                                                                                                                  Question 12d

                                                                                                                                                                  Marks: 1
                                                                                                                                                                  d)
                                                                                                                                                                  Pest management is economically and environmentally important to farmers. Insecticides can be costly, insect resistance can develop and broad-spectrum insecticides can cause beneficial insects (e.g. pollinators) to be killed when applied. Scientists have been researching the most appropriate method to manage pests of chickpea crops. They have genetically engineered C.arietinum plants with the bacterium Bacillus thuringiensis (Bt), which results in the plants releasing a toxin that kills insects that ingest it. Scientists have also been developing synthetic pyrethroids (e.g. alpha-Cypermethrin) that H.punctigera currently have a low resistance to. 

                                                                                                                                                                  In this study, scientists explored four different pest management methods over one growing season. The graphs below represent data from the experiments undertaken.q12d-7-1-medium-sq-ib-biology-sl-1

                                                                                                                                                                  State which pest control management method was most successful in controlling larvae less than 8 mm prior to pod development.

                                                                                                                                                                    Assess your score
                                                                                                                                                                      

                                                                                                                                                                    Question 12e

                                                                                                                                                                    Marks: 1
                                                                                                                                                                    e)
                                                                                                                                                                    Suggest why Bt C.arietinum appear to be more effective at controlling the larger larvae of H.punctigera.
                                                                                                                                                                      Assess your score
                                                                                                                                                                        

                                                                                                                                                                      Question 12f

                                                                                                                                                                      Marks: 3
                                                                                                                                                                      f)
                                                                                                                                                                      Compare the effectiveness of the three methods used in limiting the damage caused by H.punctigera, prior to pod development and during pod development.
                                                                                                                                                                        Assess your score
                                                                                                                                                                          

                                                                                                                                                                        Question 12g

                                                                                                                                                                        Marks: 3
                                                                                                                                                                        g)
                                                                                                                                                                        Using all the data provided, evaluate the hypothesis that the most sound pest management method is a combination of using a synthetic pyrethroid (alpha-Cypermethrin) on a genetically engineered (Bt) chickpea crop. 
                                                                                                                                                                          Assess your score