Question 1
The graph below shows ln k against  for a general reaction.
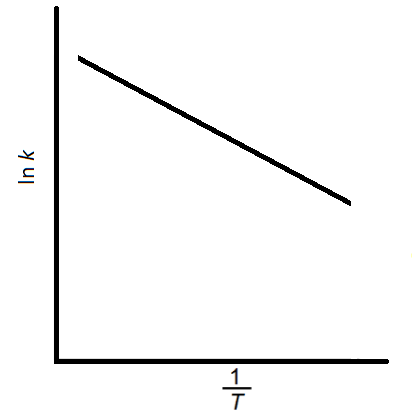
Which of the lines shows the highest activation energy compared to the original graph?
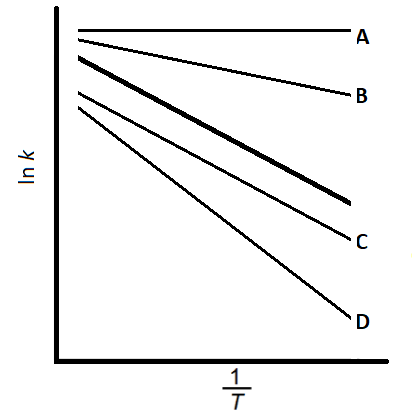
The graph below shows ln k against for a general reaction.
Which of the lines shows the highest activation energy compared to the original graph?
The following information was obtained for the rate constant, k, for a reaction at 298 K.
|
A |
Ea |
R |
|
2.57 × 10⁹ s–1 |
96.2 kJ mol–1 |
8.31 J K–1 mol–1 |
Which expression correctly represents how to calculate the rate constant, k?
%3C%2Fmo%3E%3C%2Fmrow%3E%3C%2Fmsup%3E%3C%2Fmstyle%3E%3C%2Fmath%3E--%3E%3Cdefs%3E%3Cstyle%20type%3D%22text%2Fcss%22%3E%40font-face%7Bfont-family%3A'math16fb7912ab67d794664e6eaaa85'%3Bsrc%3Aurl(data%3Afont%2Ftruetype%3Bcharset%3Dutf-8%3Bbase64%2CAAEAAAAMAIAAAwBAT1MvMi7iBBMAAADMAAAATmNtYXDEvmKUAAABHAAAAERjdnQgDVUNBwAAAWAAAAA6Z2x5ZoPi2VsAAAGcAAAA9mhlYWQQC2qxAAAClAAAADZoaGVhCGsXSAAAAswAAAAkaG10eE2rRkcAAALwAAAAEGxvY2EAHTwYAAADAAAAABRtYXhwBT0FPgAAAxQAAAAgbmFtZaBxlY4AAAM0AAABn3Bvc3QB9wD6AAAE1AAAACBwcmVwa1uragAABPQAAAAUAAADSwGQAAUAAAQABAAAAAAABAAEAAAAAAAAAQEAAAAAAAAAAAAAAAAAAAAAAAAAAAAAAAAAAAAAACAgICAAAAAg1UADev96AAAD6ACWAAAAAAACAAEAAQAAABQAAwABAAAAFAAEADAAAAAIAAgAAgAAAC4ALyIS%2F%2F8AAAAuAC8iEv%2F%2F%2F9P%2F093xAAEAAAAAAAAAAAAAAVQDLACAAQAAVgAqAlgCHgEOASwCLABaAYACgACgANQAgAAAAAAAAAArAFUAgACrANUBAAErAAcAAAACAFUAAAMAA6sAAwAHAAAzESERJSERIVUCq%2F2rAgD%2BAAOr%2FFVVAwAAAQAgAAAAoACAAAMALxgBsAQQsAPUsAMQsALUsAMQsAA8sAIQsAE8ALAEELAD1LADELACPLAAELABPDAxNzMVIyCAgICAAAEAgAAAAisDgAADACIYALEDAD%2BxAQLkMAGwBBCxAwP1sQIF5bAB1bEABeWxBQPmATMBIwHVVv6qVQOA%2FIAAAQCAAVUC1QGrAAMAMBgBsAQQsQAD9rADPLECB%2FWwATyxBQPmALEAABMQsQAG5bEAARMQsAE8sQMF9bACPBMhFSGAAlX9qwGrVgAAAAEAAAABAADVeM5BXw889QADBAD%2F%2F%2F%2F%2F1joTc%2F%2F%2F%2F%2F%2FWOhNzAAD%2FIASAA6sAAAAKAAIAAQAAAAAAAQAAA%2Bj%2FagAAF3AAAP%2B2BIAAAQAAAAAAAAAAAAAAAAAAAAQDUgBVAMgAIAKqAIADVgCAAAAAAAAAACgAAABuAAAArAAAAPYAAQAAAAQAXgAFAAAAAAACAIAEAAAAAAAEAADeAAAAAAAAABUBAgAAAAAAAAABABIAAAAAAAAAAAACAA4AEgAAAAAAAAADADAAIAAAAAAAAAAEABIAUAAAAAAAAAAFABYAYgAAAAAAAAAGAAkAeAAAAAAAAAAIABwAgQABAAAAAAABABIAAAABAAAAAAACAA4AEgABAAAAAAADADAAIAABAAAAAAAEABIAUAABAAAAAAAFABYAYgABAAAAAAAGAAkAeAABAAAAAAAIABwAgQADAAEECQABABIAAAADAAEECQACAA4AEgADAAEECQADADAAIAADAAEECQAEABIAUAADAAEECQAFABYAYgADAAEECQAGAAkAeAADAAEECQAIABwAgQBNAGEAdABoACAARgBvAG4AdABSAGUAZwB1AGwAYQByAE0AYQB0AGgAcwAgAEYAbwByACAATQBvAHIAZQAgAE0AYQB0AGgAIABGAG8AbgB0AE0AYQB0AGgAIABGAG8AbgB0AFYAZQByAHMAaQBvAG4AIAAxAC4AME1hdGhfRm9udABNAGEAdABoAHMAIABGAG8AcgAgAE0AbwByAGUAAAMAAAAAAAAB9AD6AAAAAAAAAAAAAAAAAAAAAAAAAAC5BxEAAI2FGACyAAAAFRQTsQABPw%3D%3D)format('truetype')%3Bfont-weight%3Anormal%3Bfont-style%3Anormal%3B%7D%40font-face%7Bfont-family%3A'round_brackets18549f92a457f2409'%3Bsrc%3Aurl(data%3Afont%2Ftruetype%3Bcharset%3Dutf-8%3Bbase64%2CAAEAAAAMAIAAAwBAT1MvMjwHLFQAAADMAAAATmNtYXDf7xCrAAABHAAAADxjdnQgBAkDLgAAAVgAAAASZ2x5ZmAOz2cAAAFsAAABJGhlYWQOKih8AAACkAAAADZoaGVhCvgVwgAAAsgAAAAkaG10eCA6AAIAAALsAAAADGxvY2EAAARLAAAC%2BAAAABBtYXhwBIgEWQAAAwgAAAAgbmFtZXHR30MAAAMoAAACOXBvc3QDogHPAAAFZAAAACBwcmVwupWEAAAABYQAAAAHAAAGcgGQAAUAAAgACAAAAAAACAAIAAAAAAAAAQIAAAAAAAAAAAAAAAAAAAAAAAAAAAAAAAAAAAAAACAgICAAAAAo8AMGe%2F57AAAHPgGyAAAAAAACAAEAAQAAABQAAwABAAAAFAAEACgAAAAGAAQAAQACACgAKf%2F%2FAAAAKAAp%2F%2F%2F%2F2f%2FZAAEAAAAAAAAAAAFUAFYBAAAsAKgDgAAyAAcAAAACAAAAKgDVA1UAAwAHAAA1MxEjEyMRM9XVq4CAKgMr%2FQAC1QABAAD%2B0AIgBtAACQBNGAGwChCwA9SwAxCwAtSwChCwBdSwBRCwANSwAxCwBzywAhCwCDwAsAoQsAPUsAMQsAfUsAoQsAXUsAoQsADUsAMQsAI8sAcQsAg8MTAREAEzABEQASMAAZCQ%2FnABkJD%2BcALQ%2FZD%2BcAGQAnACcAGQ%2FnAAAQAA%2FtACIAbQAAkATRgBsAoQsAPUsAMQsALUsAoQsAXUsAUQsADUsAMQsAc8sAIQsAg8ALAKELAD1LADELAH1LAKELAF1LAKELAA1LADELACPLAHELAIPDEwARABIwAREAEzAAIg%2FnCQAZD%2BcJABkALQ%2FZD%2BcAGQAnACcAGQ%2FnAAAQAAAAEAAPW2NYFfDzz1AAMIAP%2F%2F%2F%2F%2FVre7u%2F%2F%2F%2F%2F9Wt7u4AAP7QA7cG0AAAAAoAAgABAAAAAAABAAAHPv5OAAAXcAAA%2F%2F4DtwABAAAAAAAAAAAAAAAAAAAAAwDVAAACIAAAAiAAAAAAAAAAAAAkAAAAowAAASQAAQAAAAMACgACAAAAAAACAIAEAAAAAAAEAABNAAAAAAAAABUBAgAAAAAAAAABAD4AAAAAAAAAAAACAA4APgAAAAAAAAADAFwATAAAAAAAAAAEAD4AqAAAAAAAAAAFABYA5gAAAAAAAAAGAB8A%2FAAAAAAAAAAIABwBGwABAAAAAAABAD4AAAABAAAAAAACAA4APgABAAAAAAADAFwATAABAAAAAAAEAD4AqAABAAAAAAAFABYA5gABAAAAAAAGAB8A%2FAABAAAAAAAIABwBGwADAAEECQABAD4AAAADAAEECQACAA4APgADAAEECQADAFwATAADAAEECQAEAD4AqAADAAEECQAFABYA5gADAAEECQAGAB8A%2FAADAAEECQAIABwBGwBSAG8AdQBuAGQAIABiAHIAYQBjAGsAZQB0AHMAIAB3AGkAdABoACAAYQBzAGMAZQBuAHQAIAAxADgANQA0AFIAZQBnAHUAbABhAHIATQBhAHQAaABzACAARgBvAHIAIABNAG8AcgBlACAAUgBvAHUAbgBkACAAYgByAGEAYwBrAGUAdABzACAAdwBpAHQAaAAgAGEAcwBjAGUAbgB0ACAAMQA4ADUANABSAG8AdQBuAGQAIABiAHIAYQBjAGsAZQB0AHMAIAB3AGkAdABoACAAYQBzAGMAZQBuAHQAIAAxADgANQA0AFYAZQByAHMAaQBvAG4AIAAyAC4AMFJvdW5kX2JyYWNrZXRzX3dpdGhfYXNjZW50XzE4NTQATQBhAHQAaABzACAARgBvAHIAIABNAG8AcgBlAAAAAAMAAAAAAAADnwHPAAAAAAAAAAAAAAAAAAAAAAAAAAC5B%2F8AAY2FAA%3D%3D)format('truetype')%3Bfont-weight%3Anormal%3Bfont-style%3Anormal%3B%7D%3C%2Fstyle%3E%3C%2Fdefs%3E%3Ctext%20font-family%3D%22Arial%22%20font-size%3D%2214%22%20text-anchor%3D%22middle%22%20x%3D%224.5%22%20y%3D%2216%22%3E2%3C%2Ftext%3E%3Ctext%20font-family%3D%22math16fb7912ab67d794664e6eaaa85%22%20font-size%3D%2214%22%20text-anchor%3D%22middle%22%20x%3D%2210.5%22%20y%3D%2216%22%3E.%3C%2Ftext%3E%3Ctext%20font-family%3D%22Arial%22%20font-size%3D%2214%22%20text-anchor%3D%22middle%22%20x%3D%2221.5%22%20y%3D%2216%22%3E57%3C%2Ftext%3E%3Ctext%20font-family%3D%22Arial%22%20font-size%3D%2214%22%20text-anchor%3D%22middle%22%20x%3D%2232.5%22%20y%3D%2216%22%3Ex%3C%2Ftext%3E%3Ctext%20font-family%3D%22Arial%22%20font-size%3D%2214%22%20text-anchor%3D%22middle%22%20x%3D%2244.5%22%20y%3D%2216%22%3E10%3C%2Ftext%3E%3Ctext%20font-family%3D%22Arial%22%20font-size%3D%2210%22%20text-anchor%3D%22middle%22%20x%3D%2255.5%22%20y%3D%2210%22%3E9%3C%2Ftext%3E%3Ctext%20font-family%3D%22Arial%22%20font-size%3D%2214%22%20text-anchor%3D%22middle%22%20x%3D%2265.5%22%20y%3D%2216%22%3Ex%3C%2Ftext%3E%3Ctext%20font-family%3D%22Arial%22%20font-size%3D%2214%22%20font-style%3D%22italic%22%20text-anchor%3D%22middle%22%20x%3D%2277.5%22%20y%3D%2216%22%3Ee%3C%2Ftext%3E%3Ctext%20font-family%3D%22round_brackets18549f92a457f2409%22%20font-size%3D%2210%22%20text-anchor%3D%22middle%22%20x%3D%2284.5%22%20y%3D%2210%22%3E(%3C%2Ftext%3E%3Ctext%20font-family%3D%22math16fb7912ab67d794664e6eaaa85%22%20font-size%3D%2210%22%20text-anchor%3D%22middle%22%20x%3D%2291.5%22%20y%3D%2210%22%3E%26%23x2212%3B%3C%2Ftext%3E%3Ctext%20font-family%3D%22Arial%22%20font-size%3D%2210%22%20text-anchor%3D%22middle%22%20x%3D%22110.5%22%20y%3D%2210%22%3E96200%3C%2Ftext%3E%3Ctext%20font-family%3D%22math16fb7912ab67d794664e6eaaa85%22%20font-size%3D%2210%22%20text-anchor%3D%22middle%22%20x%3D%22129.5%22%20y%3D%2210%22%3E%2F%3C%2Ftext%3E%3Ctext%20font-family%3D%22Arial%22%20font-size%3D%2210%22%20text-anchor%3D%22middle%22%20x%3D%22136.5%22%20y%3D%2210%22%3E8%3C%2Ftext%3E%3Ctext%20font-family%3D%22math16fb7912ab67d794664e6eaaa85%22%20font-size%3D%2210%22%20text-anchor%3D%22middle%22%20x%3D%22141.5%22%20y%3D%2210%22%3E.%3C%2Ftext%3E%3Ctext%20font-family%3D%22Arial%22%20font-size%3D%2210%22%20text-anchor%3D%22middle%22%20x%3D%22148.5%22%20y%3D%2210%22%3E31%3C%2Ftext%3E%3Ctext%20font-family%3D%22Arial%22%20font-size%3D%2210%22%20text-anchor%3D%22middle%22%20x%3D%22160.5%22%20y%3D%2210%22%3Ex%3C%2Ftext%3E%3Ctext%20font-family%3D%22Arial%22%20font-size%3D%2210%22%20text-anchor%3D%22middle%22%20x%3D%22174.5%22%20y%3D%2210%22%3E298%3C%2Ftext%3E%3Ctext%20font-family%3D%22round_brackets18549f92a457f2409%22%20font-size%3D%2210%22%20text-anchor%3D%22middle%22%20x%3D%22185.5%22%20y%3D%2210%22%3E)%3C%2Ftext%3E%3C%2Fsvg%3E)
%3C%2Fmo%3E%3C%2Fmrow%3E%3C%2Fmsup%3E%3C%2Fmstyle%3E%3C%2Fmath%3E--%3E%3Cdefs%3E%3Cstyle%20type%3D%22text%2Fcss%22%3E%40font-face%7Bfont-family%3A'math16fb7912ab67d794664e6eaaa85'%3Bsrc%3Aurl(data%3Afont%2Ftruetype%3Bcharset%3Dutf-8%3Bbase64%2CAAEAAAAMAIAAAwBAT1MvMi7iBBMAAADMAAAATmNtYXDEvmKUAAABHAAAAERjdnQgDVUNBwAAAWAAAAA6Z2x5ZoPi2VsAAAGcAAAA9mhlYWQQC2qxAAAClAAAADZoaGVhCGsXSAAAAswAAAAkaG10eE2rRkcAAALwAAAAEGxvY2EAHTwYAAADAAAAABRtYXhwBT0FPgAAAxQAAAAgbmFtZaBxlY4AAAM0AAABn3Bvc3QB9wD6AAAE1AAAACBwcmVwa1uragAABPQAAAAUAAADSwGQAAUAAAQABAAAAAAABAAEAAAAAAAAAQEAAAAAAAAAAAAAAAAAAAAAAAAAAAAAAAAAAAAAACAgICAAAAAg1UADev96AAAD6ACWAAAAAAACAAEAAQAAABQAAwABAAAAFAAEADAAAAAIAAgAAgAAAC4ALyIS%2F%2F8AAAAuAC8iEv%2F%2F%2F9P%2F093xAAEAAAAAAAAAAAAAAVQDLACAAQAAVgAqAlgCHgEOASwCLABaAYACgACgANQAgAAAAAAAAAArAFUAgACrANUBAAErAAcAAAACAFUAAAMAA6sAAwAHAAAzESERJSERIVUCq%2F2rAgD%2BAAOr%2FFVVAwAAAQAgAAAAoACAAAMALxgBsAQQsAPUsAMQsALUsAMQsAA8sAIQsAE8ALAEELAD1LADELACPLAAELABPDAxNzMVIyCAgICAAAEAgAAAAisDgAADACIYALEDAD%2BxAQLkMAGwBBCxAwP1sQIF5bAB1bEABeWxBQPmATMBIwHVVv6qVQOA%2FIAAAQCAAVUC1QGrAAMAMBgBsAQQsQAD9rADPLECB%2FWwATyxBQPmALEAABMQsQAG5bEAARMQsAE8sQMF9bACPBMhFSGAAlX9qwGrVgAAAAEAAAABAADVeM5BXw889QADBAD%2F%2F%2F%2F%2F1joTc%2F%2F%2F%2F%2F%2FWOhNzAAD%2FIASAA6sAAAAKAAIAAQAAAAAAAQAAA%2Bj%2FagAAF3AAAP%2B2BIAAAQAAAAAAAAAAAAAAAAAAAAQDUgBVAMgAIAKqAIADVgCAAAAAAAAAACgAAABuAAAArAAAAPYAAQAAAAQAXgAFAAAAAAACAIAEAAAAAAAEAADeAAAAAAAAABUBAgAAAAAAAAABABIAAAAAAAAAAAACAA4AEgAAAAAAAAADADAAIAAAAAAAAAAEABIAUAAAAAAAAAAFABYAYgAAAAAAAAAGAAkAeAAAAAAAAAAIABwAgQABAAAAAAABABIAAAABAAAAAAACAA4AEgABAAAAAAADADAAIAABAAAAAAAEABIAUAABAAAAAAAFABYAYgABAAAAAAAGAAkAeAABAAAAAAAIABwAgQADAAEECQABABIAAAADAAEECQACAA4AEgADAAEECQADADAAIAADAAEECQAEABIAUAADAAEECQAFABYAYgADAAEECQAGAAkAeAADAAEECQAIABwAgQBNAGEAdABoACAARgBvAG4AdABSAGUAZwB1AGwAYQByAE0AYQB0AGgAcwAgAEYAbwByACAATQBvAHIAZQAgAE0AYQB0AGgAIABGAG8AbgB0AE0AYQB0AGgAIABGAG8AbgB0AFYAZQByAHMAaQBvAG4AIAAxAC4AME1hdGhfRm9udABNAGEAdABoAHMAIABGAG8AcgAgAE0AbwByAGUAAAMAAAAAAAAB9AD6AAAAAAAAAAAAAAAAAAAAAAAAAAC5BxEAAI2FGACyAAAAFRQTsQABPw%3D%3D)format('truetype')%3Bfont-weight%3Anormal%3Bfont-style%3Anormal%3B%7D%40font-face%7Bfont-family%3A'round_brackets18549f92a457f2409'%3Bsrc%3Aurl(data%3Afont%2Ftruetype%3Bcharset%3Dutf-8%3Bbase64%2CAAEAAAAMAIAAAwBAT1MvMjwHLFQAAADMAAAATmNtYXDf7xCrAAABHAAAADxjdnQgBAkDLgAAAVgAAAASZ2x5ZmAOz2cAAAFsAAABJGhlYWQOKih8AAACkAAAADZoaGVhCvgVwgAAAsgAAAAkaG10eCA6AAIAAALsAAAADGxvY2EAAARLAAAC%2BAAAABBtYXhwBIgEWQAAAwgAAAAgbmFtZXHR30MAAAMoAAACOXBvc3QDogHPAAAFZAAAACBwcmVwupWEAAAABYQAAAAHAAAGcgGQAAUAAAgACAAAAAAACAAIAAAAAAAAAQIAAAAAAAAAAAAAAAAAAAAAAAAAAAAAAAAAAAAAACAgICAAAAAo8AMGe%2F57AAAHPgGyAAAAAAACAAEAAQAAABQAAwABAAAAFAAEACgAAAAGAAQAAQACACgAKf%2F%2FAAAAKAAp%2F%2F%2F%2F2f%2FZAAEAAAAAAAAAAAFUAFYBAAAsAKgDgAAyAAcAAAACAAAAKgDVA1UAAwAHAAA1MxEjEyMRM9XVq4CAKgMr%2FQAC1QABAAD%2B0AIgBtAACQBNGAGwChCwA9SwAxCwAtSwChCwBdSwBRCwANSwAxCwBzywAhCwCDwAsAoQsAPUsAMQsAfUsAoQsAXUsAoQsADUsAMQsAI8sAcQsAg8MTAREAEzABEQASMAAZCQ%2FnABkJD%2BcALQ%2FZD%2BcAGQAnACcAGQ%2FnAAAQAA%2FtACIAbQAAkATRgBsAoQsAPUsAMQsALUsAoQsAXUsAUQsADUsAMQsAc8sAIQsAg8ALAKELAD1LADELAH1LAKELAF1LAKELAA1LADELACPLAHELAIPDEwARABIwAREAEzAAIg%2FnCQAZD%2BcJABkALQ%2FZD%2BcAGQAnACcAGQ%2FnAAAQAAAAEAAPW2NYFfDzz1AAMIAP%2F%2F%2F%2F%2FVre7u%2F%2F%2F%2F%2F9Wt7u4AAP7QA7cG0AAAAAoAAgABAAAAAAABAAAHPv5OAAAXcAAA%2F%2F4DtwABAAAAAAAAAAAAAAAAAAAAAwDVAAACIAAAAiAAAAAAAAAAAAAkAAAAowAAASQAAQAAAAMACgACAAAAAAACAIAEAAAAAAAEAABNAAAAAAAAABUBAgAAAAAAAAABAD4AAAAAAAAAAAACAA4APgAAAAAAAAADAFwATAAAAAAAAAAEAD4AqAAAAAAAAAAFABYA5gAAAAAAAAAGAB8A%2FAAAAAAAAAAIABwBGwABAAAAAAABAD4AAAABAAAAAAACAA4APgABAAAAAAADAFwATAABAAAAAAAEAD4AqAABAAAAAAAFABYA5gABAAAAAAAGAB8A%2FAABAAAAAAAIABwBGwADAAEECQABAD4AAAADAAEECQACAA4APgADAAEECQADAFwATAADAAEECQAEAD4AqAADAAEECQAFABYA5gADAAEECQAGAB8A%2FAADAAEECQAIABwBGwBSAG8AdQBuAGQAIABiAHIAYQBjAGsAZQB0AHMAIAB3AGkAdABoACAAYQBzAGMAZQBuAHQAIAAxADgANQA0AFIAZQBnAHUAbABhAHIATQBhAHQAaABzACAARgBvAHIAIABNAG8AcgBlACAAUgBvAHUAbgBkACAAYgByAGEAYwBrAGUAdABzACAAdwBpAHQAaAAgAGEAcwBjAGUAbgB0ACAAMQA4ADUANABSAG8AdQBuAGQAIABiAHIAYQBjAGsAZQB0AHMAIAB3AGkAdABoACAAYQBzAGMAZQBuAHQAIAAxADgANQA0AFYAZQByAHMAaQBvAG4AIAAyAC4AMFJvdW5kX2JyYWNrZXRzX3dpdGhfYXNjZW50XzE4NTQATQBhAHQAaABzACAARgBvAHIAIABNAG8AcgBlAAAAAAMAAAAAAAADnwHPAAAAAAAAAAAAAAAAAAAAAAAAAAC5B%2F8AAY2FAA%3D%3D)format('truetype')%3Bfont-weight%3Anormal%3Bfont-style%3Anormal%3B%7D%3C%2Fstyle%3E%3C%2Fdefs%3E%3Ctext%20font-family%3D%22Arial%22%20font-size%3D%2214%22%20text-anchor%3D%22middle%22%20x%3D%224.5%22%20y%3D%2216%22%3E2%3C%2Ftext%3E%3Ctext%20font-family%3D%22math16fb7912ab67d794664e6eaaa85%22%20font-size%3D%2214%22%20text-anchor%3D%22middle%22%20x%3D%2210.5%22%20y%3D%2216%22%3E.%3C%2Ftext%3E%3Ctext%20font-family%3D%22Arial%22%20font-size%3D%2214%22%20text-anchor%3D%22middle%22%20x%3D%2221.5%22%20y%3D%2216%22%3E57%3C%2Ftext%3E%3Ctext%20font-family%3D%22Arial%22%20font-size%3D%2214%22%20text-anchor%3D%22middle%22%20x%3D%2232.5%22%20y%3D%2216%22%3Ex%3C%2Ftext%3E%3Ctext%20font-family%3D%22Arial%22%20font-size%3D%2214%22%20text-anchor%3D%22middle%22%20x%3D%2244.5%22%20y%3D%2216%22%3E10%3C%2Ftext%3E%3Ctext%20font-family%3D%22Arial%22%20font-size%3D%2210%22%20text-anchor%3D%22middle%22%20x%3D%2255.5%22%20y%3D%2210%22%3E9%3C%2Ftext%3E%3Ctext%20font-family%3D%22Arial%22%20font-size%3D%2214%22%20text-anchor%3D%22middle%22%20x%3D%2265.5%22%20y%3D%2216%22%3Ex%3C%2Ftext%3E%3Ctext%20font-family%3D%22Arial%22%20font-size%3D%2214%22%20font-style%3D%22italic%22%20text-anchor%3D%22middle%22%20x%3D%2277.5%22%20y%3D%2216%22%3Ee%3C%2Ftext%3E%3Ctext%20font-family%3D%22round_brackets18549f92a457f2409%22%20font-size%3D%2210%22%20text-anchor%3D%22middle%22%20x%3D%2284.5%22%20y%3D%2210%22%3E(%3C%2Ftext%3E%3Ctext%20font-family%3D%22math16fb7912ab67d794664e6eaaa85%22%20font-size%3D%2210%22%20text-anchor%3D%22middle%22%20x%3D%2291.5%22%20y%3D%2210%22%3E%26%23x2212%3B%3C%2Ftext%3E%3Ctext%20font-family%3D%22Arial%22%20font-size%3D%2210%22%20text-anchor%3D%22middle%22%20x%3D%22101.5%22%20y%3D%2210%22%3E96%3C%2Ftext%3E%3Ctext%20font-family%3D%22math16fb7912ab67d794664e6eaaa85%22%20font-size%3D%2210%22%20text-anchor%3D%22middle%22%20x%3D%22110.5%22%20y%3D%2210%22%3E.%3C%2Ftext%3E%3Ctext%20font-family%3D%22Arial%22%20font-size%3D%2210%22%20text-anchor%3D%22middle%22%20x%3D%22115.5%22%20y%3D%2210%22%3E2%3C%2Ftext%3E%3Ctext%20font-family%3D%22math16fb7912ab67d794664e6eaaa85%22%20font-size%3D%2210%22%20text-anchor%3D%22middle%22%20x%3D%22121.5%22%20y%3D%2210%22%3E%2F%3C%2Ftext%3E%3Ctext%20font-family%3D%22Arial%22%20font-size%3D%2210%22%20text-anchor%3D%22middle%22%20x%3D%22128.5%22%20y%3D%2210%22%3E8%3C%2Ftext%3E%3Ctext%20font-family%3D%22math16fb7912ab67d794664e6eaaa85%22%20font-size%3D%2210%22%20text-anchor%3D%22middle%22%20x%3D%22133.5%22%20y%3D%2210%22%3E.%3C%2Ftext%3E%3Ctext%20font-family%3D%22Arial%22%20font-size%3D%2210%22%20text-anchor%3D%22middle%22%20x%3D%22140.5%22%20y%3D%2210%22%3E31%3C%2Ftext%3E%3Ctext%20font-family%3D%22Arial%22%20font-size%3D%2210%22%20text-anchor%3D%22middle%22%20x%3D%22152.5%22%20y%3D%2210%22%3Ex%3C%2Ftext%3E%3Ctext%20font-family%3D%22Arial%22%20font-size%3D%2210%22%20text-anchor%3D%22middle%22%20x%3D%22166.5%22%20y%3D%2210%22%3E298%3C%2Ftext%3E%3Ctext%20font-family%3D%22round_brackets18549f92a457f2409%22%20font-size%3D%2210%22%20text-anchor%3D%22middle%22%20x%3D%22177.5%22%20y%3D%2210%22%3E)%3C%2Ftext%3E%3C%2Fsvg%3E)
%3C%2Fmo%3E%3C%2Fmrow%3E%3C%2Fmsup%3E%3C%2Fmstyle%3E%3C%2Fmath%3E--%3E%3Cdefs%3E%3Cstyle%20type%3D%22text%2Fcss%22%3E%40font-face%7Bfont-family%3A'math1cb9e5e054830f6e45fb0c694f9'%3Bsrc%3Aurl(data%3Afont%2Ftruetype%3Bcharset%3Dutf-8%3Bbase64%2CAAEAAAAMAIAAAwBAT1MvMi7iBBMAAADMAAAATmNtYXDEvmKUAAABHAAAAERjdnQgDVUNBwAAAWAAAAA6Z2x5ZoPi2VsAAAGcAAAA9mhlYWQQC2qxAAAClAAAADZoaGVhCGsXSAAAAswAAAAkaG10eE2rRkcAAALwAAAAEGxvY2EAHTwYAAADAAAAABRtYXhwBT0FPgAAAxQAAAAgbmFtZaBxlY4AAAM0AAABn3Bvc3QB9wD6AAAE1AAAACBwcmVwa1uragAABPQAAAAUAAADSwGQAAUAAAQABAAAAAAABAAEAAAAAAAAAQEAAAAAAAAAAAAAAAAAAAAAAAAAAAAAAAAAAAAAACAgICAAAAAg1UADev96AAAD6ACWAAAAAAACAAEAAQAAABQAAwABAAAAFAAEADAAAAAIAAgAAgAAAC4ALyIS%2F%2F8AAAAuAC8iEv%2F%2F%2F9P%2F093xAAEAAAAAAAAAAAAAAVQDLACAAQAAVgAqAlgCHgEOASwCLABaAYACgACgANQAgAAAAAAAAAArAFUAgACrANUBAAErAAcAAAACAFUAAAMAA6sAAwAHAAAzESERJSERIVUCq%2F2rAgD%2BAAOr%2FFVVAwAAAQAgAAAAoACAAAMALxgBsAQQsAPUsAMQsALUsAMQsAA8sAIQsAE8ALAEELAD1LADELACPLAAELABPDAxNzMVIyCAgICAAAEAgAAAAisDgAADACIYALEDAD%2BxAQLkMAGwBBCxAwP1sQIF5bAB1bEABeWxBQPmATMBIwHVVv6qVQOA%2FIAAAQCAAVUC1QGrAAMAMBgBsAQQsQAD9rADPLECB%2FWwATyxBQPmALEAABMQsQAG5bEAARMQsAE8sQMF9bACPBMhFSGAAlX9qwGrVgAAAAEAAAABAADVeM5BXw889QADBAD%2F%2F%2F%2F%2F1joTc%2F%2F%2F%2F%2F%2FWOhNzAAD%2FIASAA6sAAAAKAAIAAQAAAAAAAQAAA%2Bj%2FagAAF3AAAP%2B2BIAAAQAAAAAAAAAAAAAAAAAAAAQDUgBVAMgAIAKqAIADVgCAAAAAAAAAACgAAABuAAAArAAAAPYAAQAAAAQAXgAFAAAAAAACAIAEAAAAAAAEAADeAAAAAAAAABUBAgAAAAAAAAABABIAAAAAAAAAAAACAA4AEgAAAAAAAAADADAAIAAAAAAAAAAEABIAUAAAAAAAAAAFABYAYgAAAAAAAAAGAAkAeAAAAAAAAAAIABwAgQABAAAAAAABABIAAAABAAAAAAACAA4AEgABAAAAAAADADAAIAABAAAAAAAEABIAUAABAAAAAAAFABYAYgABAAAAAAAGAAkAeAABAAAAAAAIABwAgQADAAEECQABABIAAAADAAEECQACAA4AEgADAAEECQADADAAIAADAAEECQAEABIAUAADAAEECQAFABYAYgADAAEECQAGAAkAeAADAAEECQAIABwAgQBNAGEAdABoACAARgBvAG4AdABSAGUAZwB1AGwAYQByAE0AYQB0AGgAcwAgAEYAbwByACAATQBvAHIAZQAgAE0AYQB0AGgAIABGAG8AbgB0AE0AYQB0AGgAIABGAG8AbgB0AFYAZQByAHMAaQBvAG4AIAAxAC4AME1hdGhfRm9udABNAGEAdABoAHMAIABGAG8AcgAgAE0AbwByAGUAAAMAAAAAAAAB9AD6AAAAAAAAAAAAAAAAAAAAAAAAAAC5BxEAAI2FGACyAAAAFRQTsQABPw%3D%3D)format('truetype')%3Bfont-weight%3Anormal%3Bfont-style%3Anormal%3B%7D%40font-face%7Bfont-family%3A'round_brackets18549f92a457f2409'%3Bsrc%3Aurl(data%3Afont%2Ftruetype%3Bcharset%3Dutf-8%3Bbase64%2CAAEAAAAMAIAAAwBAT1MvMjwHLFQAAADMAAAATmNtYXDf7xCrAAABHAAAADxjdnQgBAkDLgAAAVgAAAASZ2x5ZmAOz2cAAAFsAAABJGhlYWQOKih8AAACkAAAADZoaGVhCvgVwgAAAsgAAAAkaG10eCA6AAIAAALsAAAADGxvY2EAAARLAAAC%2BAAAABBtYXhwBIgEWQAAAwgAAAAgbmFtZXHR30MAAAMoAAACOXBvc3QDogHPAAAFZAAAACBwcmVwupWEAAAABYQAAAAHAAAGcgGQAAUAAAgACAAAAAAACAAIAAAAAAAAAQIAAAAAAAAAAAAAAAAAAAAAAAAAAAAAAAAAAAAAACAgICAAAAAo8AMGe%2F57AAAHPgGyAAAAAAACAAEAAQAAABQAAwABAAAAFAAEACgAAAAGAAQAAQACACgAKf%2F%2FAAAAKAAp%2F%2F%2F%2F2f%2FZAAEAAAAAAAAAAAFUAFYBAAAsAKgDgAAyAAcAAAACAAAAKgDVA1UAAwAHAAA1MxEjEyMRM9XVq4CAKgMr%2FQAC1QABAAD%2B0AIgBtAACQBNGAGwChCwA9SwAxCwAtSwChCwBdSwBRCwANSwAxCwBzywAhCwCDwAsAoQsAPUsAMQsAfUsAoQsAXUsAoQsADUsAMQsAI8sAcQsAg8MTAREAEzABEQASMAAZCQ%2FnABkJD%2BcALQ%2FZD%2BcAGQAnACcAGQ%2FnAAAQAA%2FtACIAbQAAkATRgBsAoQsAPUsAMQsALUsAoQsAXUsAUQsADUsAMQsAc8sAIQsAg8ALAKELAD1LADELAH1LAKELAF1LAKELAA1LADELACPLAHELAIPDEwARABIwAREAEzAAIg%2FnCQAZD%2BcJABkALQ%2FZD%2BcAGQAnACcAGQ%2FnAAAQAAAAEAAPW2NYFfDzz1AAMIAP%2F%2F%2F%2F%2FVre7u%2F%2F%2F%2F%2F9Wt7u4AAP7QA7cG0AAAAAoAAgABAAAAAAABAAAHPv5OAAAXcAAA%2F%2F4DtwABAAAAAAAAAAAAAAAAAAAAAwDVAAACIAAAAiAAAAAAAAAAAAAkAAAAowAAASQAAQAAAAMACgACAAAAAAACAIAEAAAAAAAEAABNAAAAAAAAABUBAgAAAAAAAAABAD4AAAAAAAAAAAACAA4APgAAAAAAAAADAFwATAAAAAAAAAAEAD4AqAAAAAAAAAAFABYA5gAAAAAAAAAGAB8A%2FAAAAAAAAAAIABwBGwABAAAAAAABAD4AAAABAAAAAAACAA4APgABAAAAAAADAFwATAABAAAAAAAEAD4AqAABAAAAAAAFABYA5gABAAAAAAAGAB8A%2FAABAAAAAAAIABwBGwADAAEECQABAD4AAAADAAEECQACAA4APgADAAEECQADAFwATAADAAEECQAEAD4AqAADAAEECQAFABYA5gADAAEECQAGAB8A%2FAADAAEECQAIABwBGwBSAG8AdQBuAGQAIABiAHIAYQBjAGsAZQB0AHMAIAB3AGkAdABoACAAYQBzAGMAZQBuAHQAIAAxADgANQA0AFIAZQBnAHUAbABhAHIATQBhAHQAaABzACAARgBvAHIAIABNAG8AcgBlACAAUgBvAHUAbgBkACAAYgByAGEAYwBrAGUAdABzACAAdwBpAHQAaAAgAGEAcwBjAGUAbgB0ACAAMQA4ADUANABSAG8AdQBuAGQAIABiAHIAYQBjAGsAZQB0AHMAIAB3AGkAdABoACAAYQBzAGMAZQBuAHQAIAAxADgANQA0AFYAZQByAHMAaQBvAG4AIAAyAC4AMFJvdW5kX2JyYWNrZXRzX3dpdGhfYXNjZW50XzE4NTQATQBhAHQAaABzACAARgBvAHIAIABNAG8AcgBlAAAAAAMAAAAAAAADnwHPAAAAAAAAAAAAAAAAAAAAAAAAAAC5B%2F8AAY2FAA%3D%3D)format('truetype')%3Bfont-weight%3Anormal%3Bfont-style%3Anormal%3B%7D%3C%2Fstyle%3E%3C%2Fdefs%3E%3Ctext%20font-family%3D%22Arial%22%20font-size%3D%2214%22%20text-anchor%3D%22middle%22%20x%3D%224.5%22%20y%3D%2216%22%3E2%3C%2Ftext%3E%3Ctext%20font-family%3D%22math1cb9e5e054830f6e45fb0c694f9%22%20font-size%3D%2214%22%20text-anchor%3D%22middle%22%20x%3D%2210.5%22%20y%3D%2216%22%3E.%3C%2Ftext%3E%3Ctext%20font-family%3D%22Arial%22%20font-size%3D%2214%22%20text-anchor%3D%22middle%22%20x%3D%2221.5%22%20y%3D%2216%22%3E57%3C%2Ftext%3E%3Ctext%20font-family%3D%22Arial%22%20font-size%3D%2214%22%20text-anchor%3D%22middle%22%20x%3D%2232.5%22%20y%3D%2216%22%3Ex%3C%2Ftext%3E%3Ctext%20font-family%3D%22Arial%22%20font-size%3D%2214%22%20text-anchor%3D%22middle%22%20x%3D%2244.5%22%20y%3D%2216%22%3E10%3C%2Ftext%3E%3Ctext%20font-family%3D%22Arial%22%20font-size%3D%2210%22%20text-anchor%3D%22middle%22%20x%3D%2255.5%22%20y%3D%2210%22%3E9%3C%2Ftext%3E%3Ctext%20font-family%3D%22Arial%22%20font-size%3D%2214%22%20text-anchor%3D%22middle%22%20x%3D%2265.5%22%20y%3D%2216%22%3Ex%3C%2Ftext%3E%3Ctext%20font-family%3D%22Arial%22%20font-size%3D%2214%22%20font-style%3D%22italic%22%20text-anchor%3D%22middle%22%20x%3D%2277.5%22%20y%3D%2216%22%3Ee%3C%2Ftext%3E%3Ctext%20font-family%3D%22round_brackets18549f92a457f2409%22%20font-size%3D%2210%22%20text-anchor%3D%22middle%22%20x%3D%2284.5%22%20y%3D%2210%22%3E(%3C%2Ftext%3E%3Ctext%20font-family%3D%22Arial%22%20font-size%3D%2210%22%20text-anchor%3D%22middle%22%20x%3D%2289.5%22%20y%3D%2210%22%3E8%3C%2Ftext%3E%3Ctext%20font-family%3D%22math1cb9e5e054830f6e45fb0c694f9%22%20font-size%3D%2210%22%20text-anchor%3D%22middle%22%20x%3D%2294.5%22%20y%3D%2210%22%3E.%3C%2Ftext%3E%3Ctext%20font-family%3D%22Arial%22%20font-size%3D%2210%22%20text-anchor%3D%22middle%22%20x%3D%22101.5%22%20y%3D%2210%22%3E31%3C%2Ftext%3E%3Ctext%20font-family%3D%22Arial%22%20font-size%3D%2210%22%20text-anchor%3D%22middle%22%20x%3D%22113.5%22%20y%3D%2210%22%3Ex%3C%2Ftext%3E%3Ctext%20font-family%3D%22Arial%22%20font-size%3D%2210%22%20text-anchor%3D%22middle%22%20x%3D%22127.5%22%20y%3D%2210%22%3E298%3C%2Ftext%3E%3Ctext%20font-family%3D%22math1cb9e5e054830f6e45fb0c694f9%22%20font-size%3D%2210%22%20text-anchor%3D%22middle%22%20x%3D%22140.5%22%20y%3D%2210%22%3E%2F%3C%2Ftext%3E%3Ctext%20font-family%3D%22math1cb9e5e054830f6e45fb0c694f9%22%20font-size%3D%2210%22%20text-anchor%3D%22middle%22%20x%3D%22149.5%22%20y%3D%2210%22%3E%26%23x2212%3B%3C%2Ftext%3E%3Ctext%20font-family%3D%22Arial%22%20font-size%3D%2210%22%20text-anchor%3D%22middle%22%20x%3D%22159.5%22%20y%3D%2210%22%3E96%3C%2Ftext%3E%3Ctext%20font-family%3D%22math1cb9e5e054830f6e45fb0c694f9%22%20font-size%3D%2210%22%20text-anchor%3D%22middle%22%20x%3D%22168.5%22%20y%3D%2210%22%3E.%3C%2Ftext%3E%3Ctext%20font-family%3D%22Arial%22%20font-size%3D%2210%22%20text-anchor%3D%22middle%22%20x%3D%22173.5%22%20y%3D%2210%22%3E2%3C%2Ftext%3E%3Ctext%20font-family%3D%22round_brackets18549f92a457f2409%22%20font-size%3D%2210%22%20text-anchor%3D%22middle%22%20x%3D%22177.5%22%20y%3D%2210%22%3E)%3C%2Ftext%3E%3C%2Fsvg%3E)
%3C%2Fmo%3E%3C%2Fmrow%3E%3C%2Fmsup%3E%3C%2Fmstyle%3E%3C%2Fmath%3E--%3E%3Cdefs%3E%3Cstyle%20type%3D%22text%2Fcss%22%3E%40font-face%7Bfont-family%3A'math1cb9e5e054830f6e45fb0c694f9'%3Bsrc%3Aurl(data%3Afont%2Ftruetype%3Bcharset%3Dutf-8%3Bbase64%2CAAEAAAAMAIAAAwBAT1MvMi7iBBMAAADMAAAATmNtYXDEvmKUAAABHAAAAERjdnQgDVUNBwAAAWAAAAA6Z2x5ZoPi2VsAAAGcAAAA9mhlYWQQC2qxAAAClAAAADZoaGVhCGsXSAAAAswAAAAkaG10eE2rRkcAAALwAAAAEGxvY2EAHTwYAAADAAAAABRtYXhwBT0FPgAAAxQAAAAgbmFtZaBxlY4AAAM0AAABn3Bvc3QB9wD6AAAE1AAAACBwcmVwa1uragAABPQAAAAUAAADSwGQAAUAAAQABAAAAAAABAAEAAAAAAAAAQEAAAAAAAAAAAAAAAAAAAAAAAAAAAAAAAAAAAAAACAgICAAAAAg1UADev96AAAD6ACWAAAAAAACAAEAAQAAABQAAwABAAAAFAAEADAAAAAIAAgAAgAAAC4ALyIS%2F%2F8AAAAuAC8iEv%2F%2F%2F9P%2F093xAAEAAAAAAAAAAAAAAVQDLACAAQAAVgAqAlgCHgEOASwCLABaAYACgACgANQAgAAAAAAAAAArAFUAgACrANUBAAErAAcAAAACAFUAAAMAA6sAAwAHAAAzESERJSERIVUCq%2F2rAgD%2BAAOr%2FFVVAwAAAQAgAAAAoACAAAMALxgBsAQQsAPUsAMQsALUsAMQsAA8sAIQsAE8ALAEELAD1LADELACPLAAELABPDAxNzMVIyCAgICAAAEAgAAAAisDgAADACIYALEDAD%2BxAQLkMAGwBBCxAwP1sQIF5bAB1bEABeWxBQPmATMBIwHVVv6qVQOA%2FIAAAQCAAVUC1QGrAAMAMBgBsAQQsQAD9rADPLECB%2FWwATyxBQPmALEAABMQsQAG5bEAARMQsAE8sQMF9bACPBMhFSGAAlX9qwGrVgAAAAEAAAABAADVeM5BXw889QADBAD%2F%2F%2F%2F%2F1joTc%2F%2F%2F%2F%2F%2FWOhNzAAD%2FIASAA6sAAAAKAAIAAQAAAAAAAQAAA%2Bj%2FagAAF3AAAP%2B2BIAAAQAAAAAAAAAAAAAAAAAAAAQDUgBVAMgAIAKqAIADVgCAAAAAAAAAACgAAABuAAAArAAAAPYAAQAAAAQAXgAFAAAAAAACAIAEAAAAAAAEAADeAAAAAAAAABUBAgAAAAAAAAABABIAAAAAAAAAAAACAA4AEgAAAAAAAAADADAAIAAAAAAAAAAEABIAUAAAAAAAAAAFABYAYgAAAAAAAAAGAAkAeAAAAAAAAAAIABwAgQABAAAAAAABABIAAAABAAAAAAACAA4AEgABAAAAAAADADAAIAABAAAAAAAEABIAUAABAAAAAAAFABYAYgABAAAAAAAGAAkAeAABAAAAAAAIABwAgQADAAEECQABABIAAAADAAEECQACAA4AEgADAAEECQADADAAIAADAAEECQAEABIAUAADAAEECQAFABYAYgADAAEECQAGAAkAeAADAAEECQAIABwAgQBNAGEAdABoACAARgBvAG4AdABSAGUAZwB1AGwAYQByAE0AYQB0AGgAcwAgAEYAbwByACAATQBvAHIAZQAgAE0AYQB0AGgAIABGAG8AbgB0AE0AYQB0AGgAIABGAG8AbgB0AFYAZQByAHMAaQBvAG4AIAAxAC4AME1hdGhfRm9udABNAGEAdABoAHMAIABGAG8AcgAgAE0AbwByAGUAAAMAAAAAAAAB9AD6AAAAAAAAAAAAAAAAAAAAAAAAAAC5BxEAAI2FGACyAAAAFRQTsQABPw%3D%3D)format('truetype')%3Bfont-weight%3Anormal%3Bfont-style%3Anormal%3B%7D%40font-face%7Bfont-family%3A'round_brackets18549f92a457f2409'%3Bsrc%3Aurl(data%3Afont%2Ftruetype%3Bcharset%3Dutf-8%3Bbase64%2CAAEAAAAMAIAAAwBAT1MvMjwHLFQAAADMAAAATmNtYXDf7xCrAAABHAAAADxjdnQgBAkDLgAAAVgAAAASZ2x5ZmAOz2cAAAFsAAABJGhlYWQOKih8AAACkAAAADZoaGVhCvgVwgAAAsgAAAAkaG10eCA6AAIAAALsAAAADGxvY2EAAARLAAAC%2BAAAABBtYXhwBIgEWQAAAwgAAAAgbmFtZXHR30MAAAMoAAACOXBvc3QDogHPAAAFZAAAACBwcmVwupWEAAAABYQAAAAHAAAGcgGQAAUAAAgACAAAAAAACAAIAAAAAAAAAQIAAAAAAAAAAAAAAAAAAAAAAAAAAAAAAAAAAAAAACAgICAAAAAo8AMGe%2F57AAAHPgGyAAAAAAACAAEAAQAAABQAAwABAAAAFAAEACgAAAAGAAQAAQACACgAKf%2F%2FAAAAKAAp%2F%2F%2F%2F2f%2FZAAEAAAAAAAAAAAFUAFYBAAAsAKgDgAAyAAcAAAACAAAAKgDVA1UAAwAHAAA1MxEjEyMRM9XVq4CAKgMr%2FQAC1QABAAD%2B0AIgBtAACQBNGAGwChCwA9SwAxCwAtSwChCwBdSwBRCwANSwAxCwBzywAhCwCDwAsAoQsAPUsAMQsAfUsAoQsAXUsAoQsADUsAMQsAI8sAcQsAg8MTAREAEzABEQASMAAZCQ%2FnABkJD%2BcALQ%2FZD%2BcAGQAnACcAGQ%2FnAAAQAA%2FtACIAbQAAkATRgBsAoQsAPUsAMQsALUsAoQsAXUsAUQsADUsAMQsAc8sAIQsAg8ALAKELAD1LADELAH1LAKELAF1LAKELAA1LADELACPLAHELAIPDEwARABIwAREAEzAAIg%2FnCQAZD%2BcJABkALQ%2FZD%2BcAGQAnACcAGQ%2FnAAAQAAAAEAAPW2NYFfDzz1AAMIAP%2F%2F%2F%2F%2FVre7u%2F%2F%2F%2F%2F9Wt7u4AAP7QA7cG0AAAAAoAAgABAAAAAAABAAAHPv5OAAAXcAAA%2F%2F4DtwABAAAAAAAAAAAAAAAAAAAAAwDVAAACIAAAAiAAAAAAAAAAAAAkAAAAowAAASQAAQAAAAMACgACAAAAAAACAIAEAAAAAAAEAABNAAAAAAAAABUBAgAAAAAAAAABAD4AAAAAAAAAAAACAA4APgAAAAAAAAADAFwATAAAAAAAAAAEAD4AqAAAAAAAAAAFABYA5gAAAAAAAAAGAB8A%2FAAAAAAAAAAIABwBGwABAAAAAAABAD4AAAABAAAAAAACAA4APgABAAAAAAADAFwATAABAAAAAAAEAD4AqAABAAAAAAAFABYA5gABAAAAAAAGAB8A%2FAABAAAAAAAIABwBGwADAAEECQABAD4AAAADAAEECQACAA4APgADAAEECQADAFwATAADAAEECQAEAD4AqAADAAEECQAFABYA5gADAAEECQAGAB8A%2FAADAAEECQAIABwBGwBSAG8AdQBuAGQAIABiAHIAYQBjAGsAZQB0AHMAIAB3AGkAdABoACAAYQBzAGMAZQBuAHQAIAAxADgANQA0AFIAZQBnAHUAbABhAHIATQBhAHQAaABzACAARgBvAHIAIABNAG8AcgBlACAAUgBvAHUAbgBkACAAYgByAGEAYwBrAGUAdABzACAAdwBpAHQAaAAgAGEAcwBjAGUAbgB0ACAAMQA4ADUANABSAG8AdQBuAGQAIABiAHIAYQBjAGsAZQB0AHMAIAB3AGkAdABoACAAYQBzAGMAZQBuAHQAIAAxADgANQA0AFYAZQByAHMAaQBvAG4AIAAyAC4AMFJvdW5kX2JyYWNrZXRzX3dpdGhfYXNjZW50XzE4NTQATQBhAHQAaABzACAARgBvAHIAIABNAG8AcgBlAAAAAAMAAAAAAAADnwHPAAAAAAAAAAAAAAAAAAAAAAAAAAC5B%2F8AAY2FAA%3D%3D)format('truetype')%3Bfont-weight%3Anormal%3Bfont-style%3Anormal%3B%7D%3C%2Fstyle%3E%3C%2Fdefs%3E%3Ctext%20font-family%3D%22Arial%22%20font-size%3D%2214%22%20text-anchor%3D%22middle%22%20x%3D%224.5%22%20y%3D%2216%22%3E2%3C%2Ftext%3E%3Ctext%20font-family%3D%22math1cb9e5e054830f6e45fb0c694f9%22%20font-size%3D%2214%22%20text-anchor%3D%22middle%22%20x%3D%2210.5%22%20y%3D%2216%22%3E.%3C%2Ftext%3E%3Ctext%20font-family%3D%22Arial%22%20font-size%3D%2214%22%20text-anchor%3D%22middle%22%20x%3D%2221.5%22%20y%3D%2216%22%3E57%3C%2Ftext%3E%3Ctext%20font-family%3D%22Arial%22%20font-size%3D%2214%22%20text-anchor%3D%22middle%22%20x%3D%2232.5%22%20y%3D%2216%22%3Ex%3C%2Ftext%3E%3Ctext%20font-family%3D%22Arial%22%20font-size%3D%2214%22%20text-anchor%3D%22middle%22%20x%3D%2244.5%22%20y%3D%2216%22%3E10%3C%2Ftext%3E%3Ctext%20font-family%3D%22Arial%22%20font-size%3D%2210%22%20text-anchor%3D%22middle%22%20x%3D%2255.5%22%20y%3D%2210%22%3E9%3C%2Ftext%3E%3Ctext%20font-family%3D%22Arial%22%20font-size%3D%2214%22%20text-anchor%3D%22middle%22%20x%3D%2265.5%22%20y%3D%2216%22%3Ex%3C%2Ftext%3E%3Ctext%20font-family%3D%22Arial%22%20font-size%3D%2214%22%20font-style%3D%22italic%22%20text-anchor%3D%22middle%22%20x%3D%2277.5%22%20y%3D%2216%22%3Ee%3C%2Ftext%3E%3Ctext%20font-family%3D%22round_brackets18549f92a457f2409%22%20font-size%3D%2210%22%20text-anchor%3D%22middle%22%20x%3D%2284.5%22%20y%3D%2210%22%3E(%3C%2Ftext%3E%3Ctext%20font-family%3D%22Arial%22%20font-size%3D%2210%22%20text-anchor%3D%22middle%22%20x%3D%2289.5%22%20y%3D%2210%22%3E8%3C%2Ftext%3E%3Ctext%20font-family%3D%22math1cb9e5e054830f6e45fb0c694f9%22%20font-size%3D%2210%22%20text-anchor%3D%22middle%22%20x%3D%2294.5%22%20y%3D%2210%22%3E.%3C%2Ftext%3E%3Ctext%20font-family%3D%22Arial%22%20font-size%3D%2210%22%20text-anchor%3D%22middle%22%20x%3D%22101.5%22%20y%3D%2210%22%3E31%3C%2Ftext%3E%3Ctext%20font-family%3D%22Arial%22%20font-size%3D%2210%22%20text-anchor%3D%22middle%22%20x%3D%22113.5%22%20y%3D%2210%22%3Ex%3C%2Ftext%3E%3Ctext%20font-family%3D%22Arial%22%20font-size%3D%2210%22%20text-anchor%3D%22middle%22%20x%3D%22127.5%22%20y%3D%2210%22%3E298%3C%2Ftext%3E%3Ctext%20font-family%3D%22math1cb9e5e054830f6e45fb0c694f9%22%20font-size%3D%2210%22%20text-anchor%3D%22middle%22%20x%3D%22140.5%22%20y%3D%2210%22%3E%2F%3C%2Ftext%3E%3Ctext%20font-family%3D%22math1cb9e5e054830f6e45fb0c694f9%22%20font-size%3D%2210%22%20text-anchor%3D%22middle%22%20x%3D%22149.5%22%20y%3D%2210%22%3E%26%23x2212%3B%3C%2Ftext%3E%3Ctext%20font-family%3D%22Arial%22%20font-size%3D%2210%22%20text-anchor%3D%22middle%22%20x%3D%22168.5%22%20y%3D%2210%22%3E96200%3C%2Ftext%3E%3Ctext%20font-family%3D%22round_brackets18549f92a457f2409%22%20font-size%3D%2210%22%20text-anchor%3D%22middle%22%20x%3D%22185.5%22%20y%3D%2210%22%3E)%3C%2Ftext%3E%3C%2Fsvg%3E)
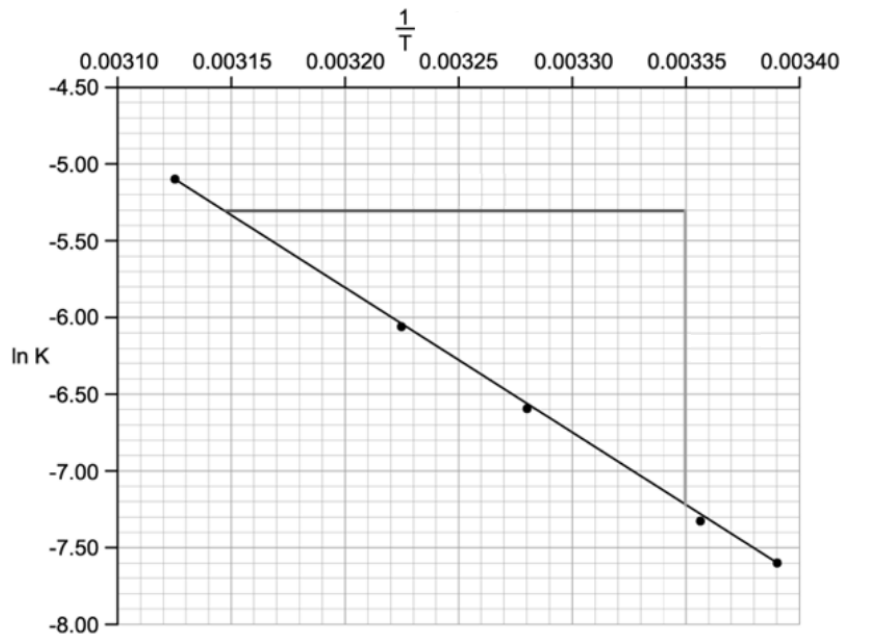
Which of the following statements about the Arrhenius plot are not correct?
ln A has an approximate value of -4.7
The gradient of the line is format('truetype')%3Bfont-weight%3Anormal%3Bfont-style%3Anormal%3B%7D%3C%2Fstyle%3E%3C%2Fdefs%3E%3Cline%20stroke%3D%22%23000000%22%20stroke-linecap%3D%22square%22%20stroke-width%3D%221%22%20x1%3D%222.5%22%20x2%3D%2232.5%22%20y1%3D%2223.5%22%20y2%3D%2223.5%22%2F%3E%3Ctext%20font-family%3D%22math1da40657c9fece7e48d30af42d3%22%20font-size%3D%2214%22%20text-anchor%3D%22middle%22%20x%3D%229.5%22%20y%3D%2214%22%3E%26%23x2212%3B%3C%2Ftext%3E%3Ctext%20font-family%3D%22Arial%22%20font-size%3D%2214%22%20font-style%3D%22italic%22%20text-anchor%3D%22middle%22%20x%3D%2219.5%22%20y%3D%2214%22%3EE%3C%2Ftext%3E%3Ctext%20font-family%3D%22Arial%22%20font-size%3D%2210%22%20font-style%3D%22italic%22%20text-anchor%3D%22middle%22%20x%3D%2228.5%22%20y%3D%2218%22%3Ea%3C%2Ftext%3E%3Ctext%20font-family%3D%22Arial%22%20font-size%3D%2214%22%20font-style%3D%22italic%22%20text-anchor%3D%22middle%22%20x%3D%2217.5%22%20y%3D%2238%22%3ER%3C%2Ftext%3E%3C%2Fsvg%3E)
The units for the x-axis are K-1
The equation of the line is ln k = format('truetype')%3Bfont-weight%3Anormal%3Bfont-style%3Anormal%3B%7D%3C%2Fstyle%3E%3C%2Fdefs%3E%3Cline%20stroke%3D%22%23000000%22%20stroke-linecap%3D%22square%22%20stroke-width%3D%221%22%20x1%3D%222.5%22%20x2%3D%2232.5%22%20y1%3D%2223.5%22%20y2%3D%2223.5%22%2F%3E%3Ctext%20font-family%3D%22math1da40657c9fece7e48d30af42d3%22%20font-size%3D%2214%22%20text-anchor%3D%22middle%22%20x%3D%229.5%22%20y%3D%2214%22%3E%26%23x2212%3B%3C%2Ftext%3E%3Ctext%20font-family%3D%22Arial%22%20font-size%3D%2214%22%20font-style%3D%22italic%22%20text-anchor%3D%22middle%22%20x%3D%2219.5%22%20y%3D%2214%22%3EE%3C%2Ftext%3E%3Ctext%20font-family%3D%22Arial%22%20font-size%3D%2210%22%20font-style%3D%22italic%22%20text-anchor%3D%22middle%22%20x%3D%2228.5%22%20y%3D%2218%22%3Ea%3C%2Ftext%3E%3Ctext%20font-family%3D%22Arial%22%20font-size%3D%2214%22%20font-style%3D%22italic%22%20text-anchor%3D%22middle%22%20x%3D%2213.5%22%20y%3D%2238%22%3ER%3C%2Ftext%3E%3Ctext%20font-family%3D%22Arial%22%20font-size%3D%2214%22%20font-style%3D%22italic%22%20text-anchor%3D%22middle%22%20x%3D%2222.5%22%20y%3D%2238%22%3ET%3C%2Ftext%3E%3C%2Fsvg%3E) + ln A
+ ln A
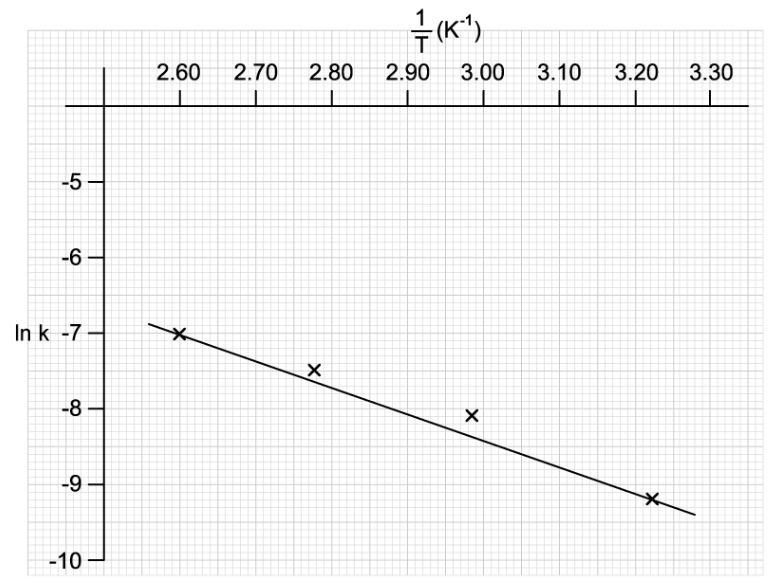
Which term from the Arrhenius equation has the incorrect units?
|
Term |
Units |
|
|
A. |
Ea |
J mol-1 |
|
B. |
R |
J K-1 mol-1 |
|
C. |
T |
K-1 |
|
D. |
e |
No units |
format('truetype')%3Bfont-weight%3Anormal%3Bfont-style%3Anormal%3B%7D%3C%2Fstyle%3E%3C%2Fdefs%3E%3Cline%20stroke%3D%22%23000000%22%20stroke-linecap%3D%22square%22%20stroke-width%3D%221%22%20x1%3D%222.5%22%20x2%3D%2236.5%22%20y1%3D%2223.5%22%20y2%3D%2223.5%22%2F%3E%3Ctext%20font-family%3D%22math1da40657c9fece7e48d30af42d3%22%20font-size%3D%2214%22%20text-anchor%3D%22middle%22%20x%3D%229.5%22%20y%3D%2214%22%3E%26%23x2212%3B%3C%2Ftext%3E%3Ctext%20font-family%3D%22Arial%22%20font-size%3D%2214%22%20font-style%3D%22italic%22%20text-anchor%3D%22middle%22%20x%3D%2223.5%22%20y%3D%2214%22%3EE%3C%2Ftext%3E%3Ctext%20font-family%3D%22Arial%22%20font-size%3D%2210%22%20font-style%3D%22italic%22%20text-anchor%3D%22middle%22%20x%3D%2232.5%22%20y%3D%2218%22%3Ea%3C%2Ftext%3E%3Ctext%20font-family%3D%22Arial%22%20font-size%3D%2214%22%20font-style%3D%22italic%22%20text-anchor%3D%22middle%22%20x%3D%2219.5%22%20y%3D%2238%22%3ER%3C%2Ftext%3E%3C%2Fsvg%3E)
format('truetype')%3Bfont-weight%3Anormal%3Bfont-style%3Anormal%3B%7D%3C%2Fstyle%3E%3C%2Fdefs%3E%3Cline%20stroke%3D%22%23000000%22%20stroke-linecap%3D%22square%22%20stroke-width%3D%221%22%20x1%3D%222.5%22%20x2%3D%2236.5%22%20y1%3D%2223.5%22%20y2%3D%2223.5%22%2F%3E%3Ctext%20font-family%3D%22math117e62166fc8586dfa4d1bc0e17%22%20font-size%3D%2214%22%20text-anchor%3D%22middle%22%20x%3D%229.5%22%20y%3D%2214%22%3E%2B%3C%2Ftext%3E%3Ctext%20font-family%3D%22Arial%22%20font-size%3D%2214%22%20font-style%3D%22italic%22%20text-anchor%3D%22middle%22%20x%3D%2223.5%22%20y%3D%2214%22%3EE%3C%2Ftext%3E%3Ctext%20font-family%3D%22Arial%22%20font-size%3D%2210%22%20font-style%3D%22italic%22%20text-anchor%3D%22middle%22%20x%3D%2232.5%22%20y%3D%2218%22%3Ea%3C%2Ftext%3E%3Ctext%20font-family%3D%22Arial%22%20font-size%3D%2214%22%20font-style%3D%22italic%22%20text-anchor%3D%22middle%22%20x%3D%2219.5%22%20y%3D%2238%22%3ER%3C%2Ftext%3E%3C%2Fsvg%3E)