0%

DP IB Chemistry: HL

Topic Questions

Home / IB / Chemistry: HL / DP / Topic Questions / 11. Measurements & Data Processes / 11.2 Synoptic Data Handling & Graphical Skills / Structured Questions: Paper 2


11.2 Synoptic Data Handling & Graphical Skills

Question 1a

Marks: 1
a)
Outline the difference between quantitative and qualitative data.
[1]
    Assess your score
      

    Question 1b

    Marks: 1
    b)
    A student uses a thermometer to measure the temperature of a beaker of water, before and after heating. The smallest thermometer division is 1.0 oC. The initial temperature of the water is 23.0 oC.

    How should the temperature change be recorded?
    [1]
      Assess your score
        

      Question 1c

      Marks: 2
      c)
      Explain how a student over-shooting the end point in a titration affects the final result of the titration calculation.
      [2]
        Assess your score
          
        Key Concepts
        Uncertainties

        Question 1d

        Marks: 2
        d)
        This question is about precision....

        i)
        Explain what is meant by the term precision in recorded data. 
        [1]
        a)
        Indented content here...
        ii)
        The table shows a set of titration results:
         
        Initial burette reading/ + 0.05 cm3 0.00
        Final burette reading/ + 0.05 cm3 23.40
        Volume delivered/ cm3  

        How should the volume delivered be recorded?

         [1]

          Assess your score
            

          Question 2a

          Marks: 2
          a)
          Outline the difference between a random error and a systematic error.
          [2]
            Assess your score
              
            Key Concepts
            Types of errors

            Question 2b

            Marks: 2
            b)
            A student forgets to tare the balance while carrying out an experiment to find the empirical formula of magnesium oxide.

            State what type of error this is, and deduce the impact on the student's mass readings.
            [2]
              Assess your score
                

              Question 2c

              Marks: 1
              c)
              Explain how random errors may be reduced in an experiment.
              [1]
                Assess your score
                  

                Question 3a

                Marks: 2
                a)
                A student carries out a thermal decomposition of copper(II) carbonate. The copper(II) carbonate is placed in a pre-weighed crucible and the crucible is weighed again when cool. The reaction that takes place is:
                CuCO3 (s)  → CuO(s) + CO2 (g)
                The results are recorded in the table.
                  Mass/ + 0.01 g
                Mass of empty crucible 38.52 g
                Mass of crucible + copper(II) carbonate 46.73 g
                Mass of crucible + copper(II) oxide 43.61 g
                 
                Calculate the mass of copper(II) oxide formed and determine the percentage uncertainty in the calculated mass.
                [2]
                  Assess your score
                    
                  Key Concepts
                  Uncertainties

                  Question 3b

                  Marks: 3
                  b)
                  Determine the theoretical yield of copper(II) oxide in part a)
                  [3]
                    Assess your score
                      
                    Key Concepts
                    Reaction Yields

                    Question 3c

                    Marks: 1
                    c)
                    Determine the percentage error in the experiment.
                    [1]
                      Assess your score
                        
                      Key Concepts
                      Percentage Error

                      Question 3d

                      Marks: 2
                      d)
                      The student forgets to turn the Bunsen burner, used to heat the crucible, to a blue flame. The yellow, sooty flame, soon coats the outside of the crucible with a black layer.

                      Identify the black layer and suggest whether the error will have a major or minor effect on their results.
                      [2]
                        Assess your score
                          
                        Key Concepts
                        Impact of errors

                        Question 4a

                        Marks: 1
                        a)
                        Explain the difference between a dependent variable and independent variable on a graph.
                        [1]
                          Assess your score
                            
                          Key Concepts
                          Drawing graphs

                          Question 4b

                          Marks: 1
                          b)
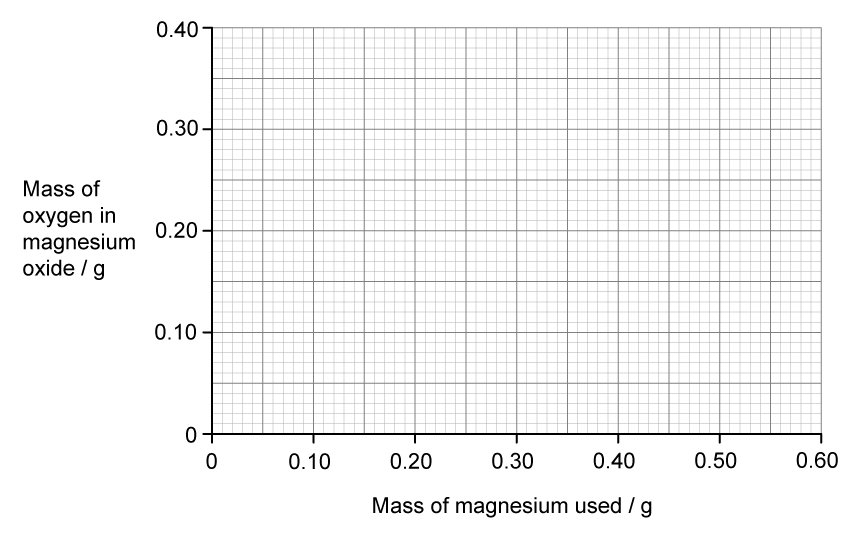
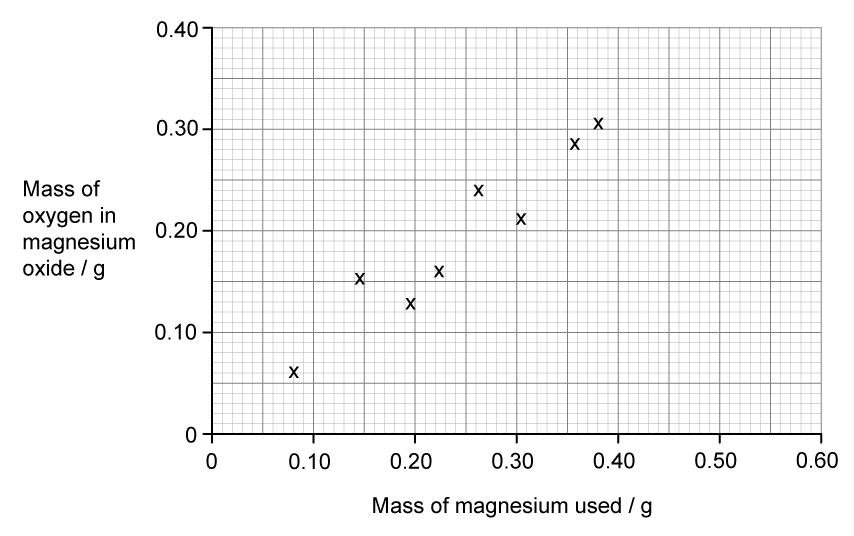
                          A student analyses a set of results from the determination of the empirical formula of magnesium oxide by burning magnesium ribbon.
                          They plot a graph on the following grid:
                          11-2-ib-sl-sq-easy-q4b
                          Identify the dependent and independent variables.
                          [1]
                            Assess your score
                              
                            Key Concepts
                            Drawing graphs

                            Question 4c

                            Marks: 2
                            c)
                            The student plots the result an obtains the following graph.
                            11-2-ib-sl-sq-easy-q4c
                            Justify whether a best fit straight line on this graph can or cannot be considered.
                            [2]
                              Assess your score
                                
                              Key Concepts
                              Best fit lines

                              Question 5a

                              Marks: 1
                              a)
                              The sketch graph below shows the variation of the mass of magnesium with the mass of oxygen, from the results of an empirical formula investigation.
                              11-2-ib-sl-sq-easy-q5a
                              Describe the relationship between the two variables.
                              [1]
                                Assess your score
                                  
                                Key Concepts
                                Sketched graphs

                                Question 5b

                                Marks: 2
                                b)
                                Using the graph in part a), show how the gradient maybe calculated and explain it's significance for magnesium and oxygen.
                                [2]
                                  Assess your score
                                    
                                  Key Concepts
                                  Analysing graphs

                                  Question 5c

                                  Marks: 2
                                  c)
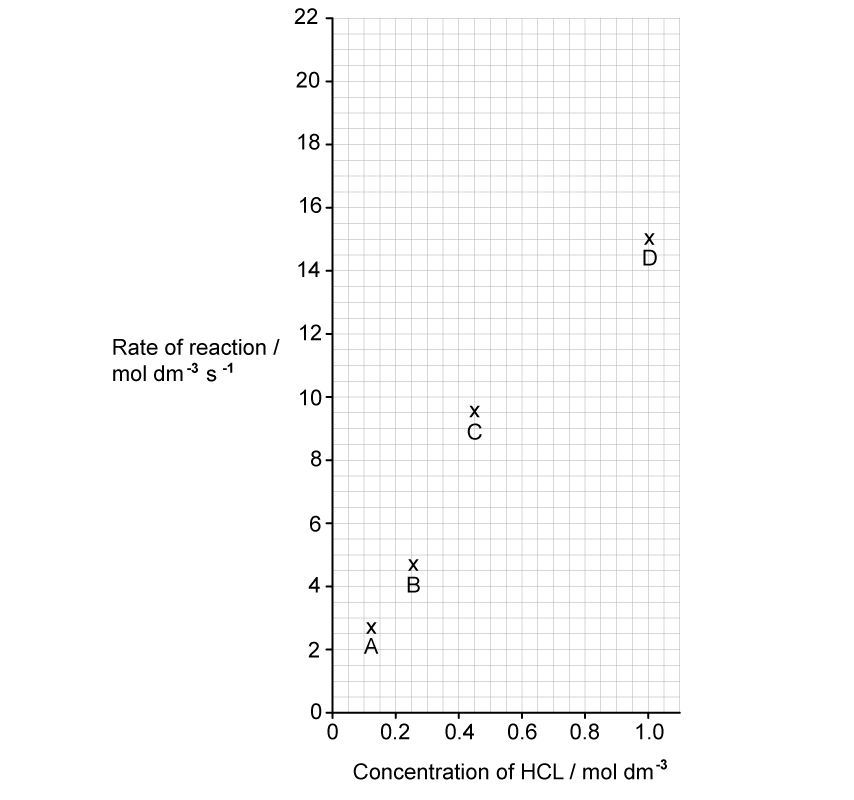
                                  The rate of reaction between magnesium and hydrochloric acid was investigated. The concentration of acid was varied and the results plotted on a graph.
                                  11-2-ib-sl-sq-easy-q5c
                                  Draw a best fit line and calculate the gradient.
                                  [2]
                                    Assess your score