Population growth curves
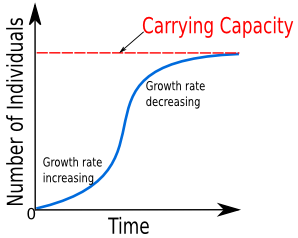
 This activity shows how populations can grow in limited environments. While it is possible to carry out wet labs or field work to see the growth of populations with this model students can quickly understand the concept of carrying capacity and way that populations grow when their resources are plentiful and when the mortality rate increases, as the population get closer to the carrying capacity of the environment.
Lesson Description
Guiding Question
What will the birth rate be like in a small population and in a huge population?
What would the death rate be like in a population with lots of resources?
If there is a lot of competition for resources what effect would this have on the death rate?
Activity 1 - Modelling population growth
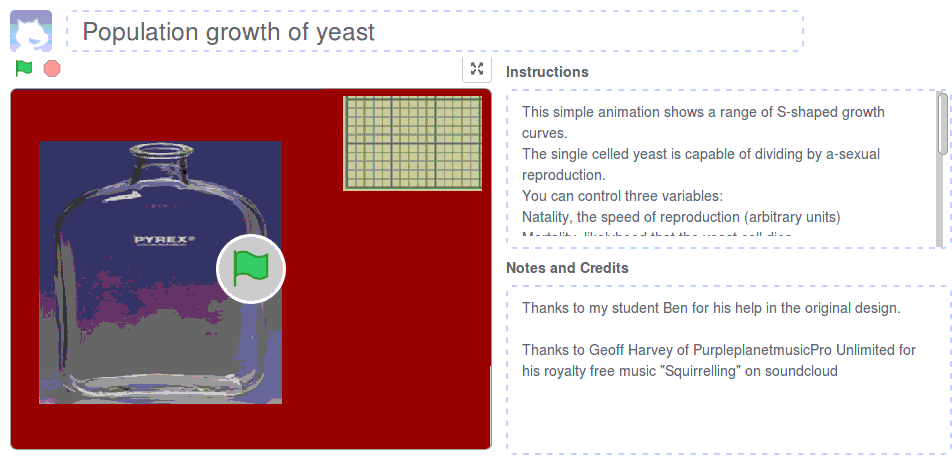
This activity uses Scratch to model the sigmoid (s-shaped) population growth curve using a singled cell organism e.g. yeast.
The organism is capable of dividing by a-sexual reproduction and the simulation always begins with one organism.
You can control three variables:
- Natality, the speed of reproduction (arbitrary units)
- Mortality, likelihood that the yeast cell dies
- Carrying capacity, the number of cells which can be sustained by the environment inside the bottle.
The rate of growth depends on the population size, the natality rate and the mortality rate.
Notice that the population can temporarily go above this capacity, but at this point some organisms will die before they reproduce, reducing the population. (![]() Link to this Scatch project on the MIT site)
Link to this Scatch project on the MIT site)
Complete the activities on the
Summary points
- In an unlimited environment when the population is low, exponential growth of a population occurs.
- As a population size reaches the carrying capacity of its environment the rate of growth slows.
- Limiting factors prevent unlimited growth of populations,
- Bottom-up control of algal blooms by lack of nutrients and
- top-down control of algae by herbivory
- Students should understand how rates of natality, mortality, immigration and emigration can be used to explain the phases of sigmoid growth curve and population size.
Activity 2 - Duckweed population growth experiment
Carry out the experiment shown in the ![]() Duckweed population growth experiment worksheet.
Duckweed population growth experiment worksheet.
Activity 3 - IB Style questions on population growth curves.
Answer the following ![]() IB style questions about population growth curves.
IB style questions about population growth curves.
Teacher's notes
Activity 1 is an introduction to the concepts of natality and mortality, as well as carrying capacity. The Stratch animation of a yeast population can be modified by students. The sliders allow changes to be made to the population model. In the vast majority of settings an s-shaped growth curve is produced.
The worksheet attached to this activity takes students through an introductory activity, but more is possible and this can be adapted to suit a class. This simulation could even be used to collect data to use in graphs as the lists of populations can be exported at the end.
There is no mention of immigration or emigration in these activities, and these terms are listed in the IB guide.
Activity 2 is a wet lab that takes 5 weeks. It only takes a few minutes to set up and could be completed during a lesson which involved activity 1 or activity 3.
Activity 3 is a short set of IB style data analysis questions about population growth and carrying capacity.
There are some S-shaped growth curve - IB style questions - model answers here.
Below are a few extra links, which may be useful in adapting the activities.
"Population Dynamics of Duckweed," an activity from Access Excellence Activities Exchange by Truman Holtzclaw, Sacramento High School, Sacramento, CA
A quite complicated experiment but a detailed exploaration of population growth theory and maths
http://courses.k-state.edu/spring2003/BIOL/BIOL632/Adobe_Docs/Lab_2.pdf

 IB Docs (2) Team

