Modelling nutrients
Option C - Ecology Activities for learning 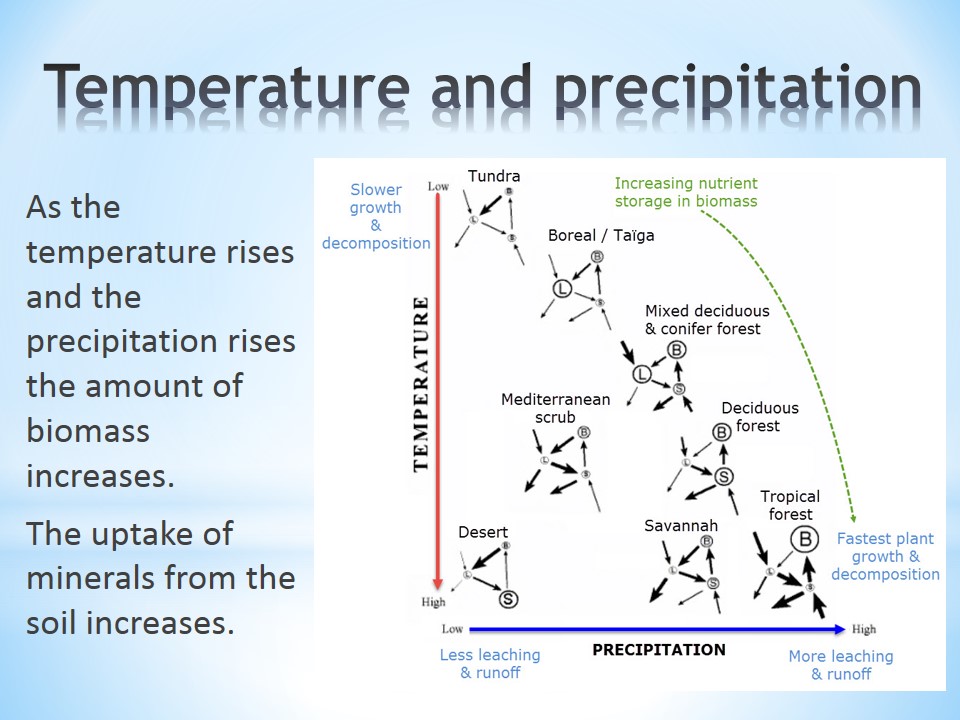 Students are first introduced to Gersmehl diagrams through a few simple slides before they explore comparison between the diagrams for different ecosystem. Students then construct their own diagrams to show the inter-relationships between nutrient stores in a grassland before investigating differences in the flows between taiga, desert and tropical rainforest. This information can be applied to an example of how humans interfere with nutrient cycling when they fertilize soil or cut down trees.
Lesson Description
Guiding Question
In 1976, Philip Gersmehl described mineral nutrient flow using a diagram made of circles and arrows.
What types of 'mineral nutrients are his diagrams based on?
It was his hobby to find unexpected repercussions of human activity on ecosystems. One such example is that fertilizing fields of crops causes algal blooms in adjacent ponds. Can you think of another unexpected repercussion?
Activity 1 - Gersmehl Diagrams
Read the following slides which explain how Gersmehl diagrams show the inter-relationships between nutrient stores and flows.
Gersmehl diagrams and minerals:
Gersmehl diagrams and minerals:
Gersmehl diagrams and minerals:
Gersmehl diagrams and minerals:
Gersmehl diagrams and minerals:
Gersmehl diagrams and minerals:
Gersmehl diagrams and minerals:
Gersmehl diagrams and minerals:
Gersmehl diagrams and minerals:
The Gersmehl diagram
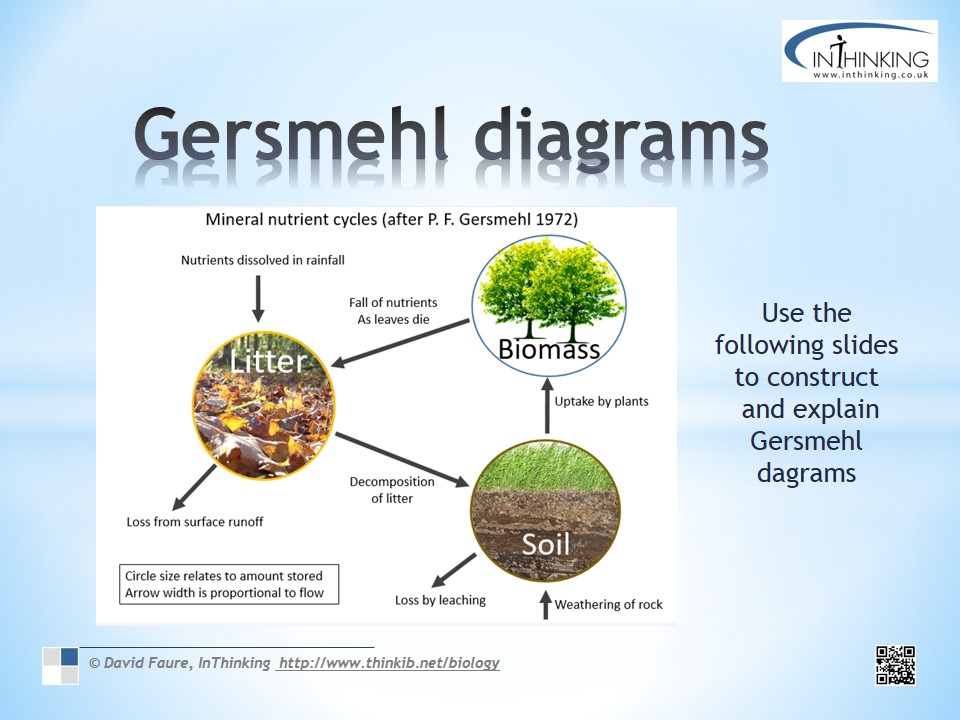
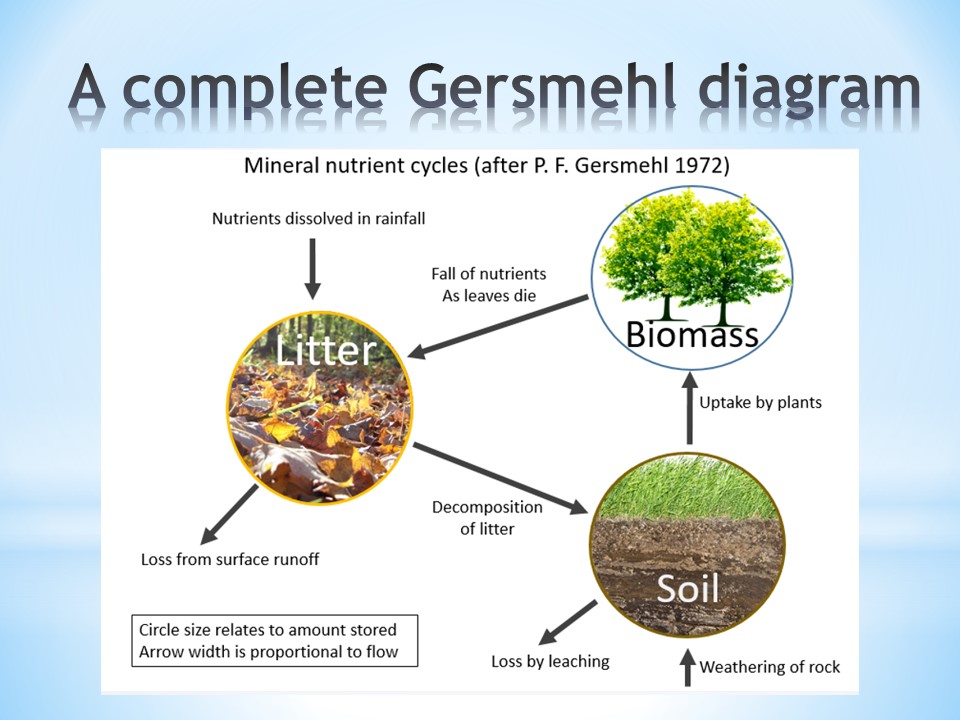
The Gersmehl diagram was created in 1976 by P. F. Gersmehl with the purpose of showing the differences in nutrient flow and storage between different ecosystems and the connectedness of different parts of the ecosystems.
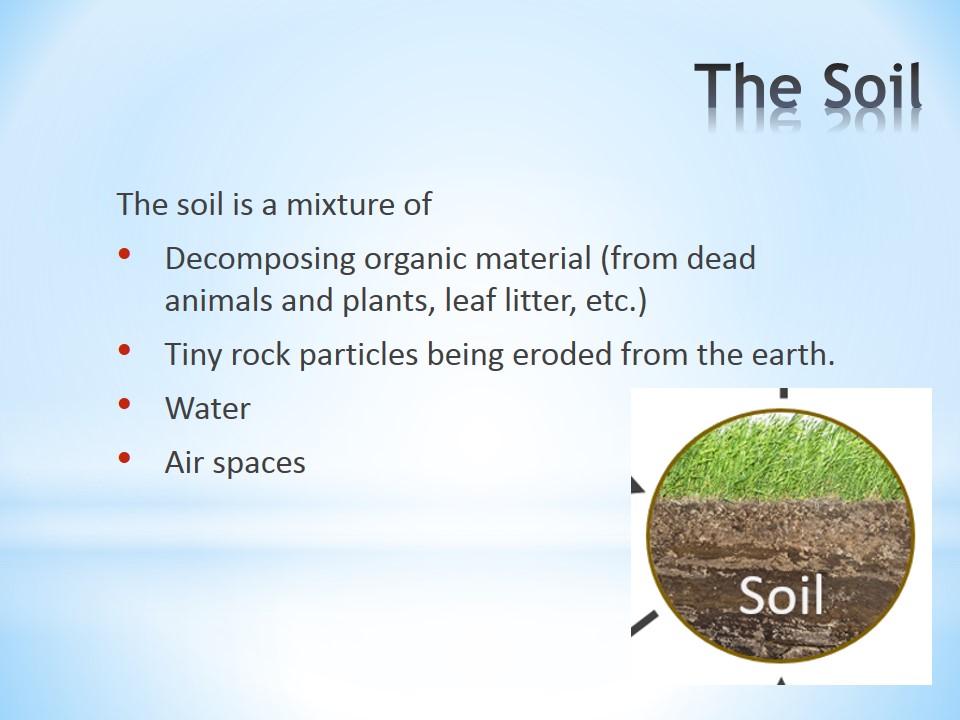
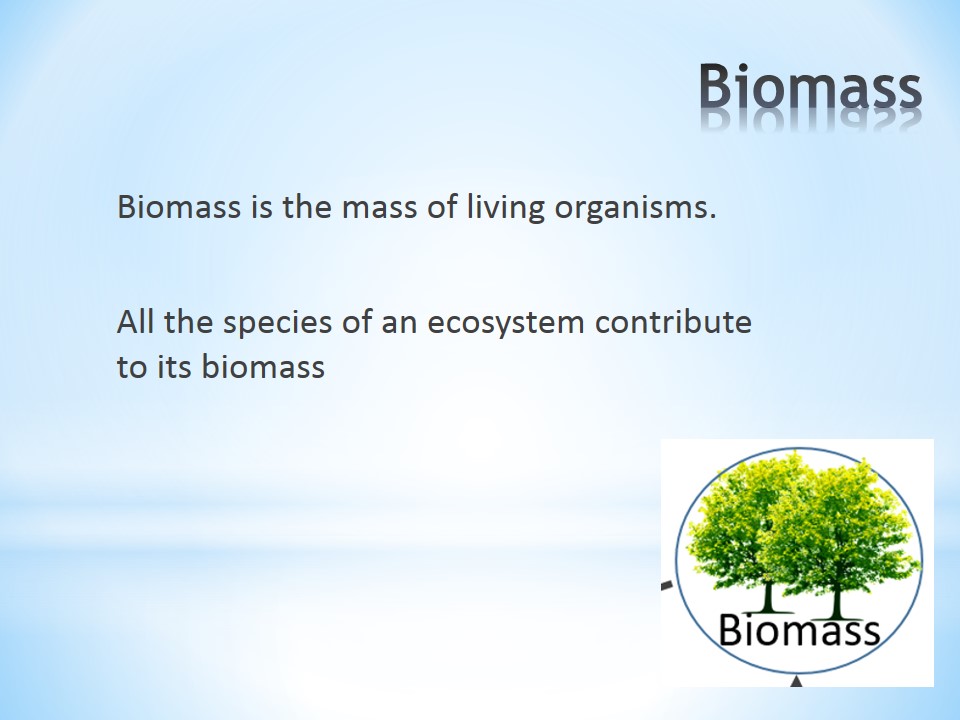
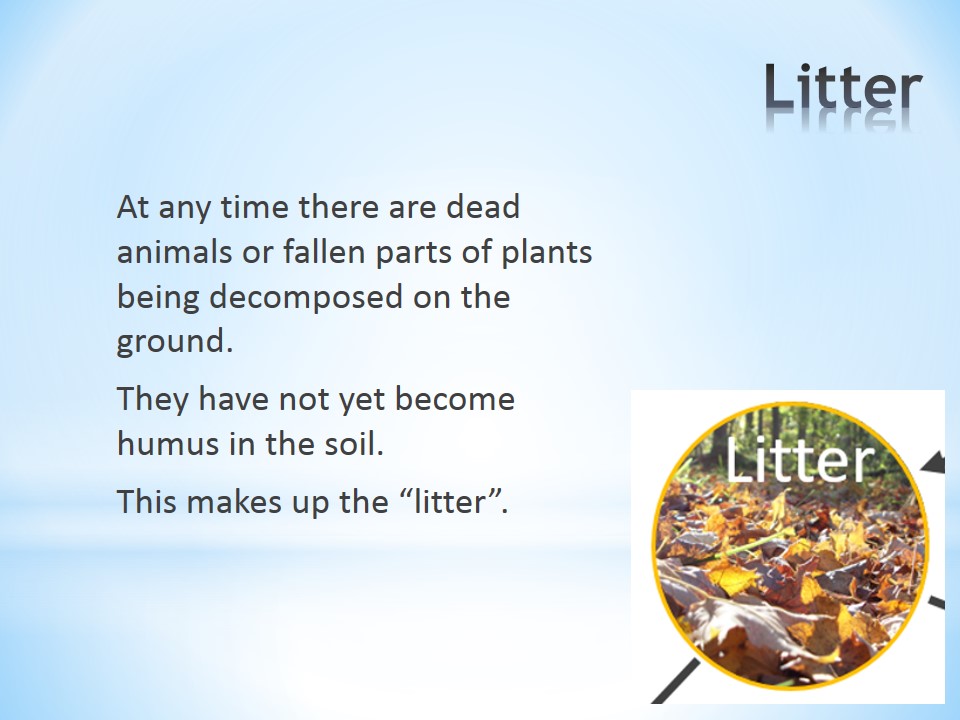
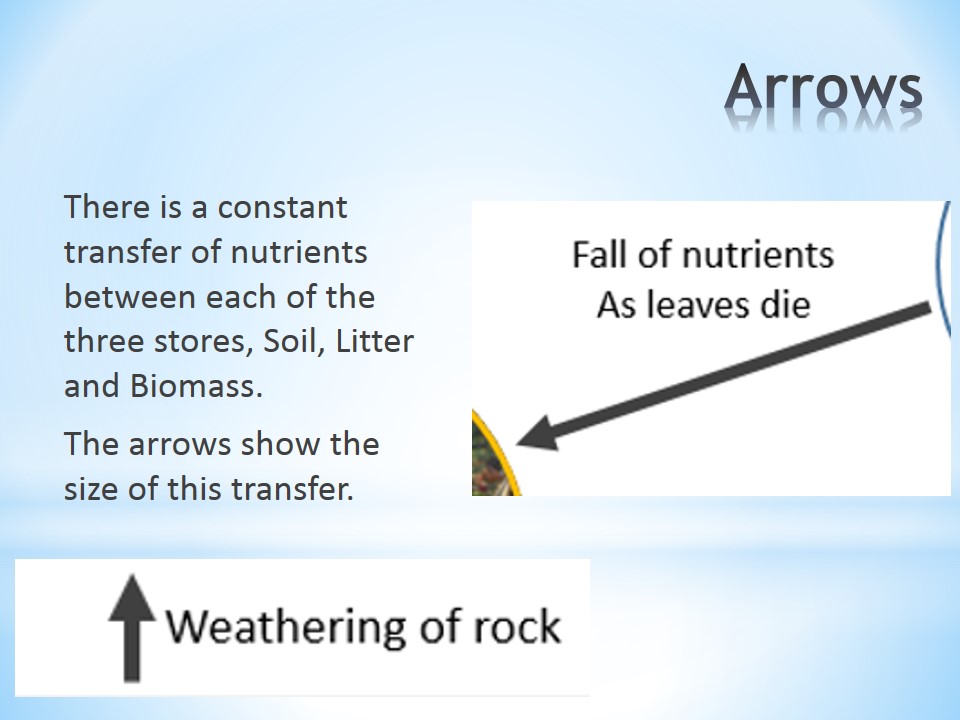
It is a diagram showing the amount of nutrients transferred and stored between three areas (soil, litter and biomass).
It is simply constructed from Circles and Arrows.
Circle size is proportional to the amount of nutrients stored;
Arrow width is proportional to the amount of nutrient flow;
Activity 2 - Describing ecosystems using Gersmahl diagrams
Answer the questions on the Gersmehl diagram activity worksheet shown below. What do the diagram tell us about the differences between taiga, desert and tropical rainforest. In the final activity draw a Gersmahl diagram from some data provided.
Activity 3 - An interactive Gersmehl diagram
The following interactive Gersmehl diagram simulation Gersmehl interactive produces a diagram in response to changes in the precipitation and temperature of the environment. The effects of each of the abiotic factors and the size of the three nutrient reservoirs are used to model changes in the system.
Experiment with the simulation and answer the questions below.
Note: If you are in a rush. When you change the temperature or precipitation the model changes faster if you click "reset", to reset the diagram to equal sized nutrient reservoirs - otherwise the changes can take a long time.
This is in nature. If it suddenly starts raining in the desert, plants will not immediately begin growing, the soil needs to build up it's nutrient store, this happens slowly, especially if there is only a small amount of litter, because there are few plants.
Questions
1. Describe the size of the three mineral nutrient reservoirs in Taiga.
2. Compare and contrast the sizes of nutrient reservoirs in Tropical rainforest and in Desert.
3. Explain how the size flux 'Uptake' could be influenced by:
b) The amount of precipitation?
Click the eye icon to display suggested model answers.
Model answers
1. Describe the size of the three mineral nutrient reservoirs in Taiga.
The soil if often poor and so the nutrient reservoir in the soil is small.
2. Compare and contrast the sizes of nutrient reservoirs in Tropical rainforest and in Desert.
The Biomas reservoir is smaller in Desert than in Tropical rainforest.
The Soil reservoir is larger in the desert than in the tropical rainforest
The litter reservoir is about the same size in both, very small, but for different reasons.
3. Explain how the size flux 'Uptake' could be influenced by:
The more biomass there is the more plant roots there are to take up mineral nutrients from the soil.
So more biomass will lead to more uptake.
b) The amount of precipitation?
The higher the temperature the more rapid enzyme activity will be, and
thus more active transport can take place absorbing nitrates, increasing uptake.
Higher temperatures could increase transpiration, increasing uptake.
However, high temperatures could cause 'water stress' stomata to close and reduced uptake.
Teacher's notes
An alternative Biogeography, by P.E.Gersmehl, 1976. The introduction is an interesting read.
Activity two gives students an opportunity to describe differences between different diagrams and to consider explanation of possible reasons why these differences exist.
There are some suggested answerss here for the students worksheet.
Activity three is an opportunity to further explore Gersmehl diagrams and the connectedness of the differenct stores of nutrients. Using the Scratch simulation students can adjust the precipitation and temperature and watch the diagram changes as the different fluxes and reservoirs adjust in order to achieve an equilibrium. This would make an excellent extension activitiy.