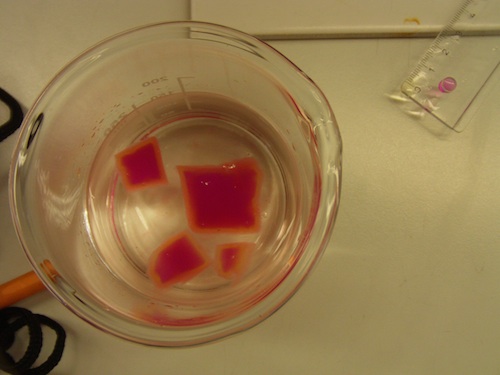
SA to Volume practical activity
What limits the maximum size of a cell?
The volume of a cell determines the needs of that cell for oxygen and other resources, as the metabolism increases according to the volume of cytoplasm.
The surface area controls the rate of uptake of the oxygen.
This experiment shows the effect of increasing size on the rate of diffusion of materials into and out of the cytoplasm of a cell.
Lesson Description
Guiding Questions
What is the effect of size on a living cell?
Does the surface area increase at the same rate as the volume in larger cells?
Activity 1 Laboratory experiment
![]() SA/Vol ratio- student instructions
SA/Vol ratio- student instructions
Safety
Working with 1M acids - wear lab coats & eye protection.
The agar blocks contain alkali so wash hands afterwards.
Method
- Cut cubes of agar with the length of sides of 2.0 cm, 1.5 cm, 1.0 cm and 0.5 cm.
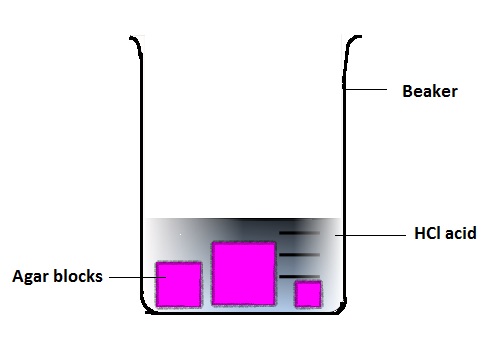
Several blocks of each size can be prepared. - Measurements should be as precise as possible and you should record the uncertainty of their measurements. This is often +/- the smallest unit on the ruler.
- Pour enough 1M HCl into a beaker to just cover the largest block.
- Place the agar blocks in the 1M HCl
- Record the time taken for each of the blocks to change colour completely.
Several blocks of each size can be placed in the same beaker.
After the experiment:
The acid should be disposed of according to local rules, but typically pour into running water in the lab sinks.
The agar can be disposed of in the garbage.
Activity 2 Data processing
- Make a table of the class data showing the times taken for colour change to occur in the blocks of different sizes.
- Calculate averages and standard deviations
- Present this processed data in an appropriate graph.
- Write a Conclusion of the practical including an evaluation.
Theory: for use in the Conclusion
The simple geometry of cube volume Volume = l x w x h and surface area SA = 6*(l x h) is needed. Knowledge of how to use acids carefully and wearing eye protection is very important!
Drawing unit cubes of 1 x 1 x 1 and 10 x 10 x 10 will get students to see the difference.
A big misconception students have is the unit size is the important factor and not the ratio of SA / Vol. Reducing the fractions to a ratio will help students to visualize this.
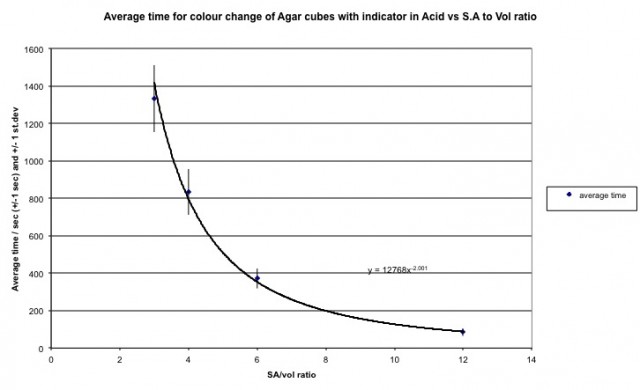
The crux of the matter is "why are cells so small?" so the emphasis is on keeping cells from getting too big. The graph of time taken for the colour change to occur versus the SA/Vol ratio is an inverse curve. The curve shows that as cells get larger, the ratio increases rapidly. As materials and heat move across the surface and are produced by the volume, a larger cell has trouble getting materials in fast enough to meet the metabolic needs while heat and wastes accumulate faster than the cell can lose these by diffusion. The consequence is for cells to do one of two things.
1. cells divide to form smaller cells to increase the SA/Vol ratio
2. increase their surface area by folding, as with the microvilli.
Making the link as to why fingers, toes and ears get colder faster than other body parts can be useful to illustrate the SA/Volume ratio too. The ecological and evolutionary link of heat loss and ear size of Arctic foxes versus tropical desert foxes can also be made.
Extension Activity
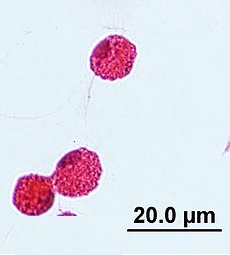
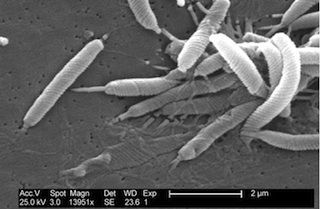
Select images of structures, cells and organelles with scale bars to find the actual SA / Vol ratio. Here are images of red phagocytes with a 20.0 micron scale bar, bacterial cells with a 2 micron scale bar and microvilli with a 100nm scale bar.
Can students find the surface area to volume ratios of a cylinder such as microvilli and bacterial cells or for the sphere of phagocytes? Be sure to work in the same units as the agar blocks for comparisions!
Further reading
In preparation for the stem cell topic, students should read about cell differentiation and specialisation.
Questions to answer:
- What is differentiation?
- What is the difference between differentiation and specialization?
- What are stem cells?
- Where are stem cells found?
- What can stem cells be used for?
Teachers notes
Preparation - 1 day in advance
This practical takes less than 2 hours but the largest block (2.0 cm sides) can take over 20 minutes. The time remaining after the data collection can be used by the students to collect the class data for data processing. With the organisation and clean up time this could be done in one hour if everyone is well prepared.
The agar cake should be made no more than one day in advance as the agar is not sterilised and so will begin to support microbe growth. This growth can be reduced by refrigerating the agar and covering the surface tightly with cellowrap ( plastic food wrap).
Materials
A stiff agar cake can be made following this recipe. This needs to be tested with local materials so that the cake is quite stiff. If the agar is not stiff enough, the students will have trouble cutting neat blocks.
- Mix 180 g Agar-agar in 3dm3 cool water and bring to a boil, stirring regularly. This will cause the agar-agar to dissolve.
- Add 1 spatula Cresol red for the acid-base indicator, which turn purplish-red in alkali, pale yellow in acid.
- Add 5 ml Sodium hydroxide 1M NaOH to obtain a purplish-red colour. Mix well for uniformity.
- Pour into a cake pan or form ( not used for cakes anymore!) and allow to cool and solidify. This is best overnight.
Further Notes
This process allows for the students to recognise the difficulty with an end point determination- when is the colour really gone. This is an important lesson for students to learn!
An alternative to this experiment is to make a stiff salt agar cake and to use datalogger conductivity probes to measure the changes of conductivity over time as the ions diffuse out of the agar. Different beakers would be needed for each cube.

 IB Docs (2) Team

