 IB Docs (2) Team

Predicting ecosystems
 The climate obviously affects the growth of plants in any given area of the Earth. In this activity students are introduced to a range of Biomes and their climates through a Google Earth tour. The analysis of climographs showing the relationship between temperature, rainfall and the type of ecosystem forms the basis of the second activity and an IB style question using an unfamiliar diagram showing how precipitation and temperature affect the type of Biome which is found test the student's application of knowledge
Lesson Description
Guiding Question
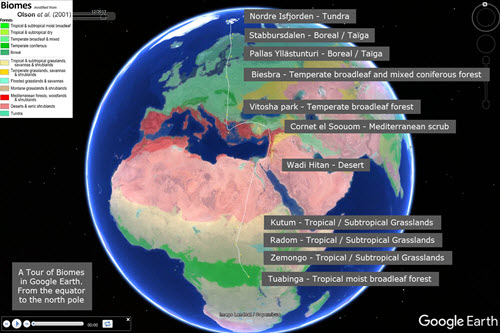
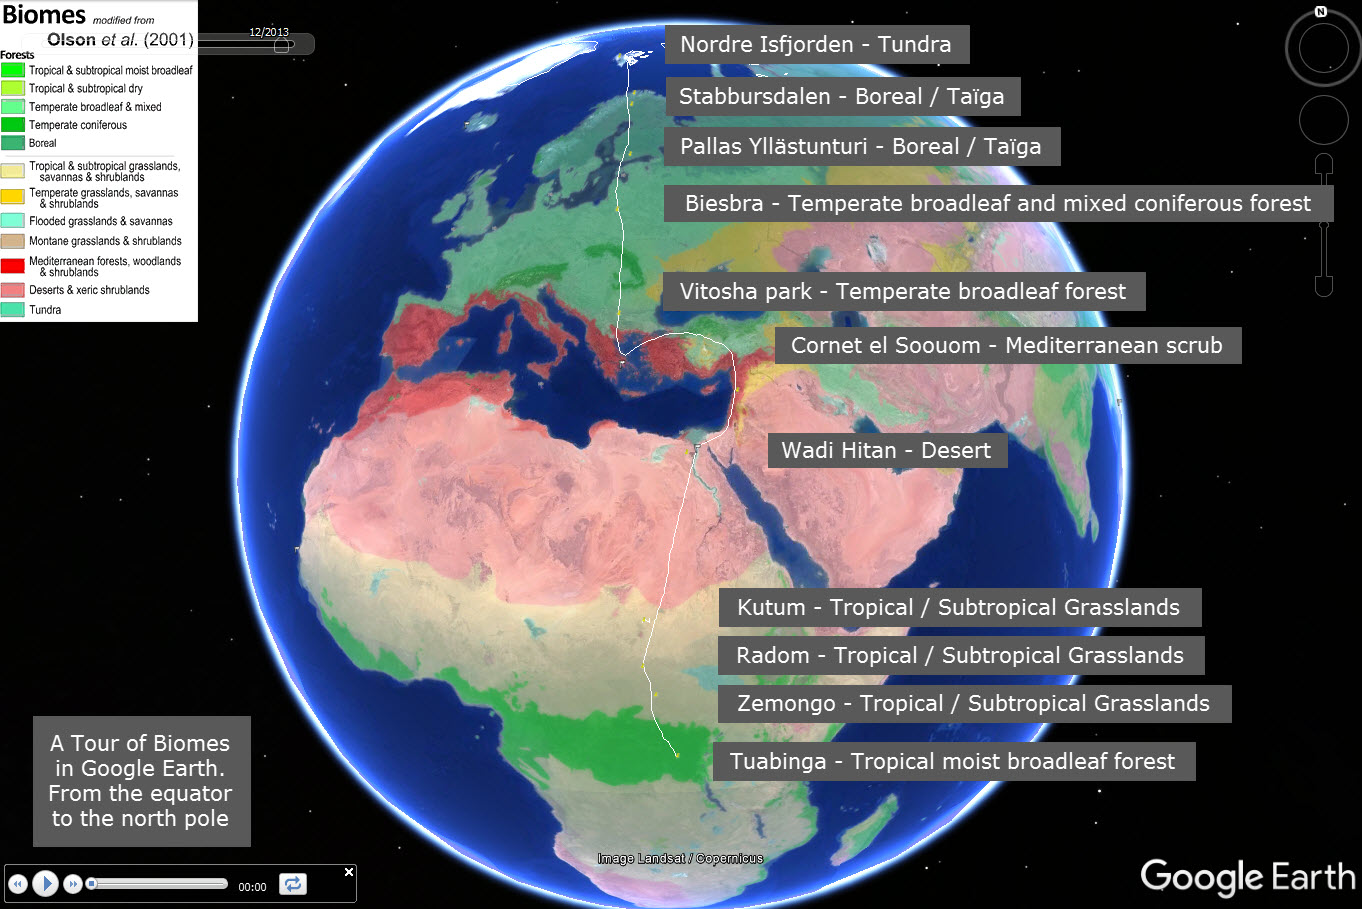
This is a selection of images of a "Terrestrial Biomes" layer on Google Earth.
Climate can be used to predict the type of stable ecosystem that will emerge in an area.
Describe the climate and how it changes in each of the Biomes from the equator to the poles?

Activity 1 - Biomes of the Earth
Using Google Earth it is possible to browse the Biomes of your continent, or make a tour of the earth.
Google Earth exploration of biomes
- Download Google Earth - if you don't have it already.
- Open the Terrestrial Biomes (Olson et al. 2001) layer. A different colour represents each Biome.
- Rotate the globe to display your region and Identify the biomes around you.
- Use the Zoom to get a map of the best size to see place names which you know.
- Adjust the transparency of the Biomes layer in the left hand menu.
- Take a tour from the Equator to the Poles. Create your own or follow this simple Biome tour.
- Note at which latitudes ( °N ) do the biomes begin.
This video ![]() Video of a Google earth tour shows a Google Earth tour from the Equator to the North Pole.
Video of a Google earth tour shows a Google Earth tour from the Equator to the North Pole.
At several Biomes it pauses, and zooms in to look closely at the vegetation in the Biome.
The video ( Of the Google Earth Biome tour) visits the following places.
Questions
Use the key to identify the main Biomes in your region.
follow the equator around the earth - list the Biomes which are found on the equator.
Complete a tour of the earth at the tropic of cancer 30°N - which biomes are found here.
Follow the biomes from the north pole to the equator, identify each biome you travel through.
Activity 2 - Climographs
Climographs summarise the annual climate in a given place. They show rainfall and temperature over the twelve months of the year. This data is often summarised by phrases like, "very low precipitation and cold temperatures throughout the year."
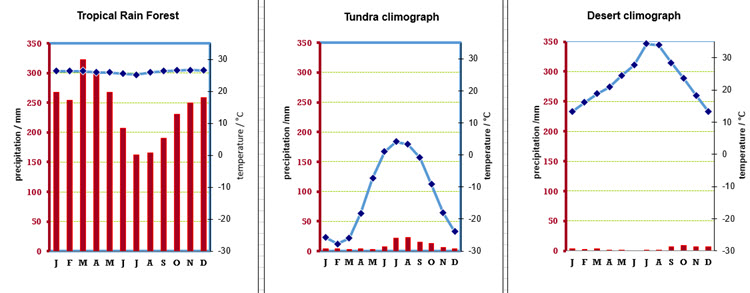
Answer the questions on the ![]() Biomes student activity sheet shown below. These cover the interpretation of climographs and their use to predict the climax community growing in each area.
Biomes student activity sheet shown below. These cover the interpretation of climographs and their use to predict the climax community growing in each area.
Activity 3 - IB style questions about climographs and biomes
The Holridge Life Zone Classification scheme explores the interaction between precipitation and evaporation at different temperatures found in different parts of the Earth. The diagram of life zone classifications

Potential evapo-transpiration is the amount of evaporation that would occur if water were not limited.
Answer the following IB-style questions about this diagram, and it's usefulness in predicting the consequence of climate change.
Teacher's notes
There are a range of ways this activity could run in a lesson. If students have access to Google earth then it is great to download the biome layer and the biome tour for students to navigate themselves. A video is included of this tour, but the quality of the images is not as good as in Google Earth live, and there is obviously no opportunity to stop and zoom in at any point which there is in the Google Earth.
Activity 2 gets students to think about the climatic causes of the vegetation types growing in each biome, using climographs and a table of details. The final column of this table gives information about biomass and soil which will be useful in the construction of Gersmehl diagrams.
The aim of the IB style questions is to test the students understanding of the underlying effects of precipitation and temperature in a slightly new context. The original paper can be found here:
Holridge's famous paper - Holdridge, L.R. (1947). "Determination of world plant formations from simple climatic data". Science. 105 (2727): 367–8. doi:10.1126/science.105.2727.367
It is interesting to note that Holdridge used these diagrams during his work on Haiti. The last question asks students to suggest how the diagram could be used for different altitudes, as Holdridge did himself in the original version.
 Twitter
 Facebook
 LinkedIn