Option C - Ecology Activities for learning
Lesson Plans for Option C - Ecology.
The ideas for learning activities on this page cover the IB guide for this topic. There is a mix of laboratory work, theory lessons, and assessment materials with model answers.
Species and communities - planning sheet C1This simple sheet sets out the learning objectives, essential questions and some ideas for assessment for the following activities. | ||
 | Describing communitiesTime: 1hr A theoretical lesson to look at the role of organisms in food webs. Beginning with a short explanation of the roles and limiting factors this activity quickly moves to a model community and a challenge for students to build a stable community of organisms. A final activity to research ecosystem roles of local species completes the lesson. | |
 | Limits and zones labTime: 1hr This lesson begins by getting students to consider what it is like to be a small plant growing in some dunes. Understanding the needs of an individual illustrates the concepts of limits of tolerance and zones of stress. A practical online activity measuring the distribution of animals on a rocky shore is next followed by a field work exercise sampling plants on a dunes. There is a final simple data analysis activity, as well as some sample data for the rocky shore analysis. | |
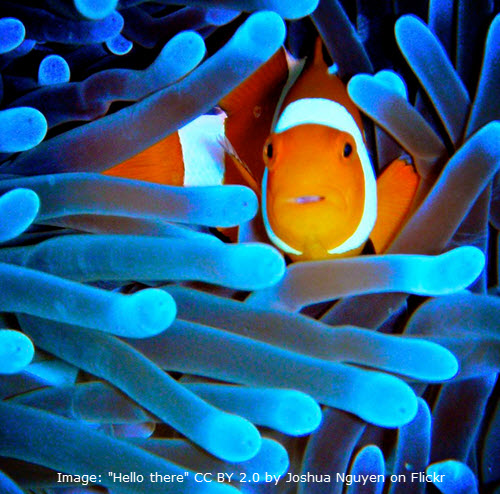 | Symbiosis vs Competitive exclusionTime: 1hr The "Niche concept" is notorious as it's definition has never quite been pinned down and there exist many slight variations. This activity introduces the niche concept and the difference between realized and fundamental niches using Paramecium. There is a second activity with a simulation of the Paramecium experiment of Gause illustrating competitive exclusion before a final activity about symbiosis in coral reefs between the coral polyps and a dinoflagellate algae, 'Zooanthella". | |
Communities & Ecosystems - planning sheet C2This simple sheet sets out the learning objectives, essential questions and some ideas for assessment for the following activities. | ||
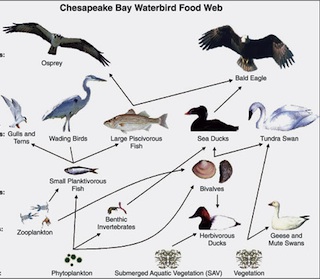 | Modelling energy flow & Eating insectsTime: 1hr This activity builds on the SL Ecology topic 'Energy in food chains'. Food chains show species in Trophic levels and multiple food chains usually exist within a community, shown by a food web. The most important concept with such diagrams is the flow of energy. This activity uses pyramids of energy and energy flow diagrams to illustrate the differences in conversion ratios between grasshoppers and mammals like cows and rabbits. Students are expected to comparison and explain the pyramids of energy from different ecosystems. | |
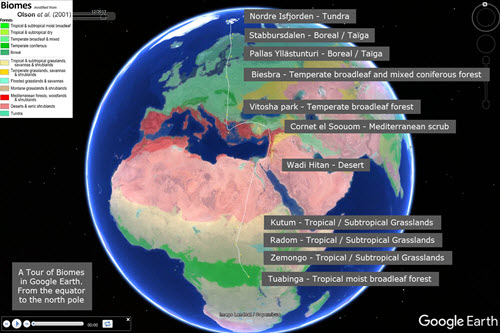 . . | Predicting ecosystemsTime: 1hr The climate obviously affects the growth of plants in any given area of the Earth. In this activity students are introduced to a range of Biomes and their climates through a Google Earth tour. The analysis of climographs showing the relationship between temperature, rainfall and the type of ecosystem forms the basis of the second activity and an IB style question using an unfamiliar diagram showing how precipitation and temperature affect the type of Biome which is found test the student's application of knowledge Points to check ...
| |
.jpg) | Disturbance vs DiversityTime: 1hr Disturbance influences the structure and rate of change within ecosystems. This activity gives students some information about the role of disturbance in communities and asks them to use the information to argue that oil pipelines can increase diversity, and then why they might harm a climax forest community. A short practical activity to illustrate this sort of ecological study follows and an online analysis of some photographs showing primary succession completes the activity. | |
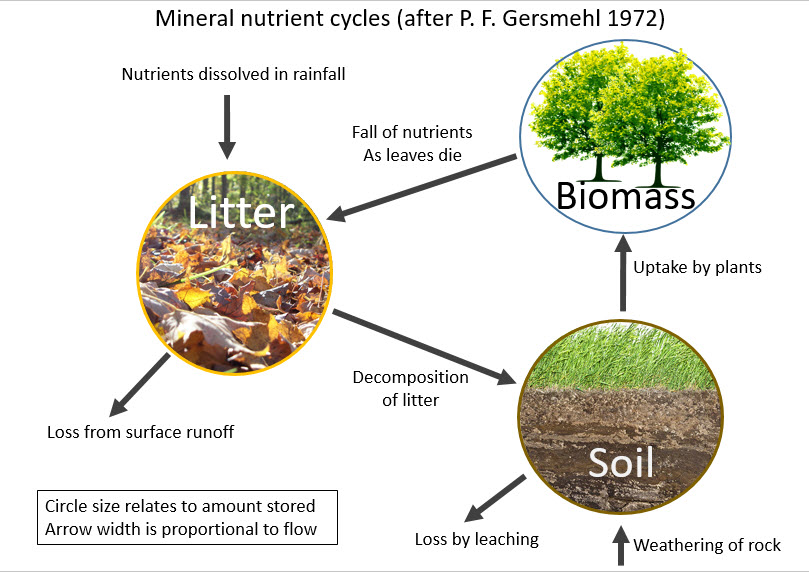 . . | Modelling nutrientsTime: 1hr Students are first introduced to Gersmehl diagrams through a few simple slides before they explore comparison between the diagrams for different ecosystem. Students then construct their own diagrams to show the inter-relationships between nutrient stores in a grassland before investigating differences in the flows between taiga, desert and tropical rainforest. This information can be applied to an example of how humans interfere with nutrient cycling when they fertilize soil or cut down trees. | |
Impact of humans - planning sheet C3This simple sheet sets out the learning objectives, essential questions and some ideas for assessment for the following activities. | ||
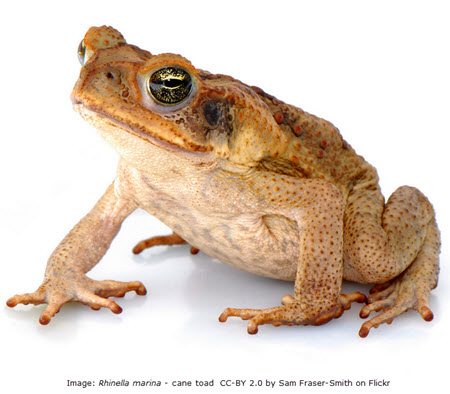 . . | Invasive speciesTime: 1hr Two short videos introduce students to the problem os invasive species and the cane toad in particular. In a second activity students identify the essential qualities of a species for it to become invasive and then search a database to find another relevant example of an invasive species in their local environment. A few IB style questions complete this activity. | |
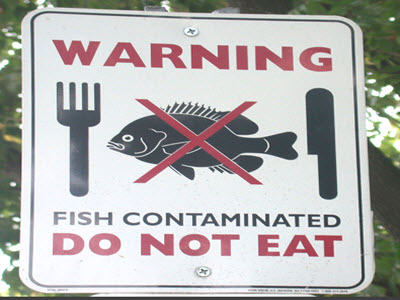 | BiomagnificationTime: 1hr Biomagnification is the process where pollutants become concentrated in the tissues of organisms at higher trophic levels. In this activity students analyse and explain some simple data from a food chain including ring-billed gulls and discuss the trade-off between control of the malarial parasite and DDT pollution. | |
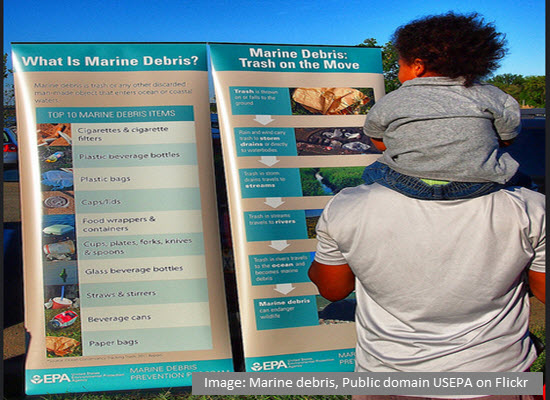 | Plastic debrisTime: 1hr Students watch an short emotive presentation and video about the tragic death of Laysan albatross chicks on Midway Atoll in the north Pacific. They are given an opportunity to deconstruct this presentation and to think about it scientifically using critical thinking. A research activity follows leading to a data based IB style question about Laysan Albatross chicks and other species of seabirds. | |
Conservation of biodiversity - planning sheet C4This simple sheet sets out the learning objectives, essential questions and some ideas for assessment for the following activities. | ||
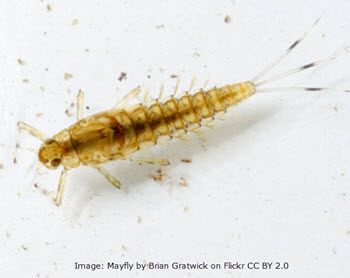 | Indicator species & biotic indexOptions Options Time: 1hr Indicator species are species who can be easily identified and sampled and which are sensitive to some type of air pollution. There are many examples of such species including Lichens growing on trees and the larvae of Mayfly, Stonefly and Cadissfly. The presence and absence of groups of indicator species are sometimes combined into a system known as a biotic index. In this activity students will experience the use of two indicator species and a biotic index. | |
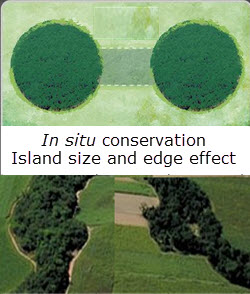 | Conservation methodsTime: 1hr In this activity students research a local example of captive breeding to explore the issues around ex-situ conservation and reintroduction of endangered species. Simple explanatory slides compare in-situ and ex-situ conservation methods and the important bio-geographical aspects of nature reserve design. An IB style question completes this activity. | |
 | Biodiversity estimationsTime: 1hr The newspapers are full of alarming headlines about loss of biodiversity, but what does this mean exactly? In this activity students explore species richness and evenness in different examples of field data. They use this data to calculate and to explain the Simpson's reciprocal diversity index. This could be a great opportunity for some real fieldwork, but if there is too little time, there is some data to analyse. | |
Populations - Planning sheet C5 HLThis simple sheet sets out the learning objectives, essential questions and some ideas for assessment for the following activities. | ||
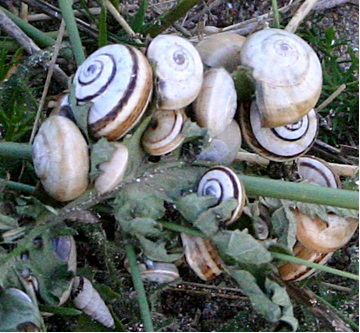 | Lincoln Index activitiesHow do biologists make estimates of the number of giant pandas left in the wild? Because animals often move and hide this task is really difficult but the Lincoln index provides a solution. In this activity students collect two samples of animals and use this clever method to estimate a population. It can be carried out as fieldwork outside of school, in the school grounds or as a lab activity using beans as animals in a tray of sand. | |
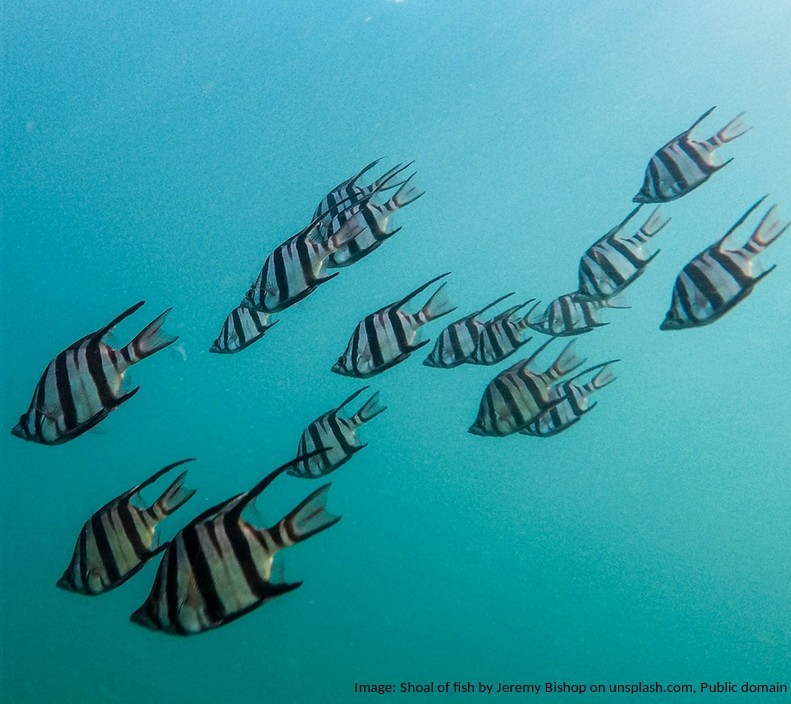 | Population growth curvesThis activity shows how populations can grow in limited environments. While it is possible to carry out wet labs or field work to see the growth of populations with this model students can quickly understand the concept of carrying capacity and way that populations grow when their resources are plentiful and when the mortality rate increases, as the population get closer to the carrying capacity of the environment. | |
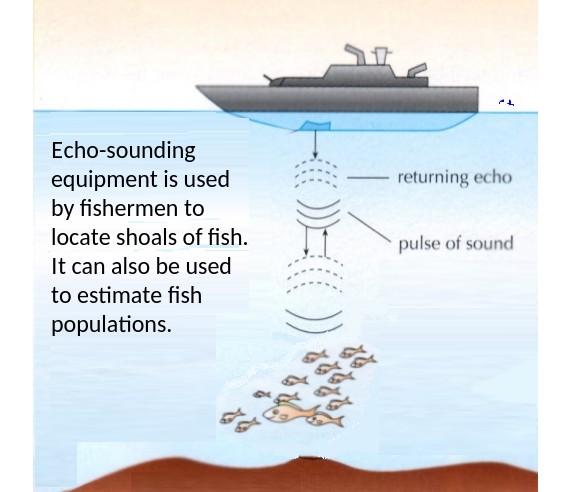 | Fisheries and populationsIn this activty students look at the advantages and the limitations of the three methods of estimating fish populations, echo-location, capture-mark-release-recapture and study research about the cod stocks of tha Baltic sea and two theories about algal blooms, one top down theory and another bottom up. | |
Nutrient cycles - Planning sheet C6 HLThis simple sheet sets out the learning objectives, essential questions and some ideas for assessment for the following activities. | ||
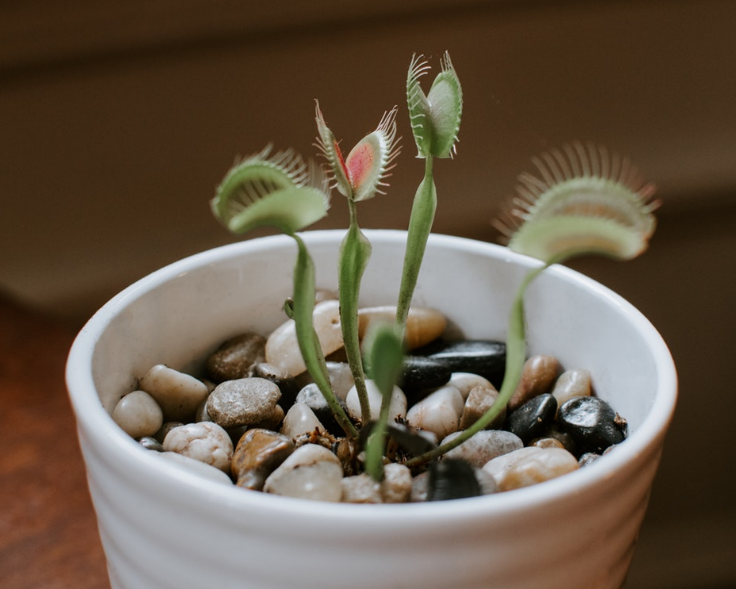
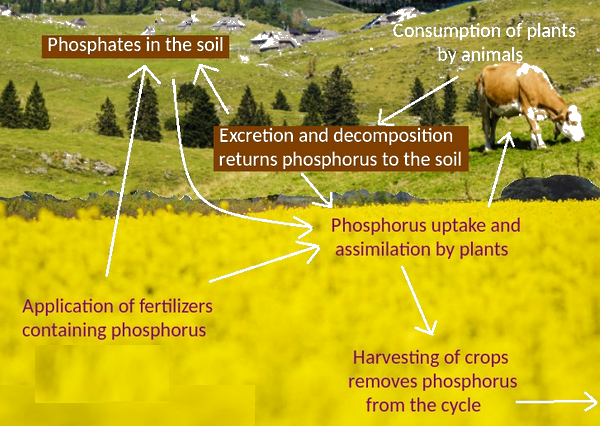
| Nitrogen cycle - applicationsThis activity introduces the chemicals of the nitrogen cycle and the concept or biogeochemical cycles. Some simple revision flashcards cards can be printed or practised online and there are two interesting examples of the nitrogen cycle, in carnivorous plants and in a home aquarium. The activity is completed using some IB style questions covering eutrophication and agriculture. Phosphorus cyclePhosphorus is an important element in cells, it is vital for the formation of plasma membrane, DNA and ATP. In agriculture, phosphorus is added to the soil using fertilizer, to increase agricultural production. This activity is covers the understandings of the phosphorus cycle. There is a short introductory exercise followed by an in-depth research activity and a tricky Ib style 'Discuss' question. |

 IB Docs (2) Team

