 IB Docs (2) Team

IA Analysis - ANOVA or t-test?
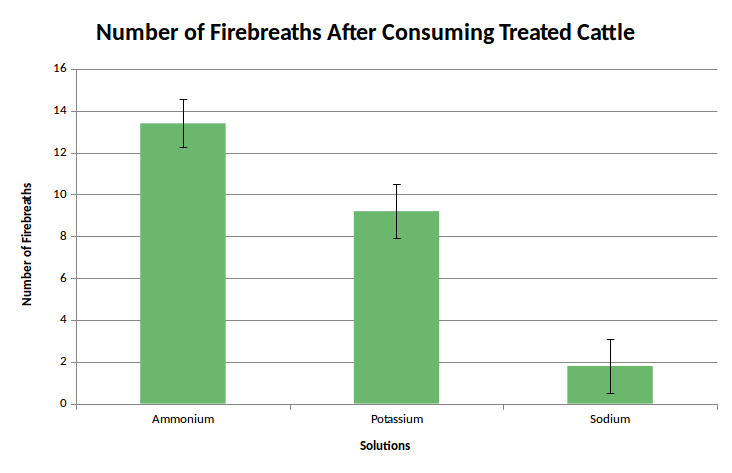
If you can plot the data from your investigation in a bar graph of averages, with three or more bars, (like the graph shown) then ANOVA may be a good statistical test for you to use.
To compare two means, a t-test works well but it's not good practise to do multiple t-tests, one in twenty will give a "false significant difference" at P<0.05 level of significance.
If you have more than two means to test then you shouldn't use a t-test, the ANOVA test is better. The Analysis Of Variance (ANOVA) is used to test whether the means of more than two samples are significantly different from one another.
One Way ANOVA.
The graph shows the results from and experiment to test the effect of three different fire retardant treatments on a species of fire breathing dragon, Dragonis terribilis.
Fifteen dragons were recruited and randomly assigned one type of treatment to stop them breathing fire.
There are three different treatments ( 3 groups of 5 dragons).
[Note: 10 dragons in each group would be better, but dragons are quite difficult to recruit!]
For 24 hours after the treatment, the number of breathing fire incidents 'Firebreaths' by each dragon was counted.
The results were recorded in this table.
| Number of Firebreaths after Ammonium treatment | Number of Firebreaths after Potassium treatment | Number of Firebreaths after Sodium treatment | |
| Trial 1 | 14 | 8 | 3 |
| Trial 2 | 12 | 9 | 1 |
| Trial 3 | 13 | 8 | 2 |
| Trial 4 | 13 | 11 | 3 |
| Trial 5 | 15 | 10 | 0 |
Studying the average number of fire breaths, we can see that it looks like there is a difference between the treatments.
| Mean number of Firebreaths | 13.4 | 9.2 | 1.8 |
| Standard. Deviation | 1.1 | 1.3 | 1.3 |
One treatment, sodium, looks more effective than the others.
We want to test the data to see if there is a significant difference between the averages.
Statistics uses the variability of each set of results to estimate the probability that they results could happen if there is not really any difference between the means.
We can't use a T-test because we have more than two means, so ANOVA should be used.
This will test whether the data show a significant difference from the null hypothesis.
Nancy Morgan explains how to use Excel to calculate an ANOVA test. (The data is available here if you want to follow along.)
The example above is a case of one-way ANOVA. One-way as there is only one variable (category) whose effect has been studied. Thus the basic idea is to test whether the samples are all alike or not.
Why Not Multiple T-Tests?
As mentioned above, the t-test can only be used to test differences between two means. When there are more than two means, it is possible to compare each mean with each other mean using many t-tests. But conducting such multiple t-tests can lead to false measures of significance ( 1 in 20 t-tests look significant when there is no significnat difference, because p<0.05 means just that, once in twenty tests you wold get these results when there is no difference.) So to avoid this problem we use ANOVA for testing hypotheses concerning means when there are several populations.
One way and Two way ANOVA
If an experiment has several independent variables, for example testing the treatments and recoding results separately for male and female dragons, then a two way ANOVA could be used to test whether there was a significant difference from the null hypothesis that there is no difference between gender of dragons, and that there is no difference between the type of treatment.
For the same reason that it's best to avoid multiple t-tests it is also best to avoid multiple ANOVA tests, and in this case the solution is to do a two way ANOVA. This might be a reflection on the research question of the investigation not being focused enough.
What has caused this significant difference, if there is one?
In the above experiment there may be a significant difference between the treatments given to the dragons.
We may be tempted to conclude that the differences exist due to the differences in the effectiveness of the treatments.
The ANOVA test does not prove that the independent variable has caused the change seen in the data, it only shows the probability of getting the experimental data if there really was no real difference. This difference may also be the result of other, possibly unknown, factors.
Assumptions
ANOVA uses a small set of measurements (the sample) from a larger set of possible values (the population)
There are some assumptions used in ANOVA.
- Each group sample is drawn from a normally distributed population.
- All populations have a common variance.
- The observations are sampled randomly and independently of each other.
- For the test to be reliable the sample sizes for each of the groups are preferably at least 10.
(Sample sizes for each group must be larger than the number of groups) - The presence of outliers in a sample can also cause problems, so this should be mentioned in evaluation if there are any.
Chi-squared test
A chi-squared test, for goodness of fit could be used to test whether the data fits the null hypothesis.
but if the data is likely to be normally distributed and standard deviations are calculated then the ANOVA test is better.
 Twitter
 Facebook
 LinkedIn