Paper 3 Section A - questions
 Paper 3 section A is a new part of the IB Biology examinations this year in 2016
The following details are adapted from Inthinking Chemistry pages by Geoff Neuss and information from the IBO
- Section A is worth 15 marks and covers skills related to the prescribed practicals or to experimental techniques in general.
- Questions will probably be similar in HL and SL in any one year
- It will have two parts,
- one data response question (worth approx. 9 marks)
- several short-answer questions on experimental work, (worth approx. 6 marks)
- It is likely that questions on the Nature of Science will also be asked in Section A.
The answer to Question 17 in the document Frequently Asked Questions, on the OCC, states that,
"some of the questions in section A of Paper 3 may be related to the prescribed practicals or to experimental techniques in general."
As there are no prescribed experiments, only prescribed areas or techniques, the examiners cannot assume that all students are familiar with the same practical experiment. This means that the questions testing experimental work are likely to have a stem giving some specific information about the experiment.
The following questions show ideas of possible questions related to each of the prescribed practicals and may be a useful beginning in student preparations for paper 3.
Practical 1: Calculating magnification and actual size
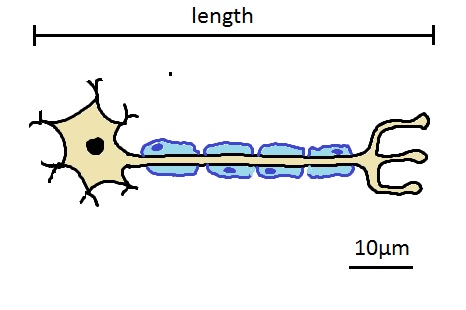
Calculate the actual length of the neurone shown beloww.
A safe method is to do the following:
- Estimate the number of scale bars which fit into the image, and estimate the length.
In this case about 6 or 7 scale bars so 60 - 70 µm length. - Measure the length of the diagram in milimetres (not cm - because it's easier to divide a larger number and avoid decimals).
- Measure the length of the scale bar in milimetres.
- Divide the length of the diagram by the length of the scale bar and multiply by the size written on the scale bar.
e.g. 140mm length / 20mm scale bar x 10µm = 70µm
Practical 1: Calculating magnification and actual size
Calculate the magnification of the diagram of a motor neurone show below.

To calculate magnification you only need the scale bar.
- Measure the length of the scale bar in mm
- Convert this to the same units as written on the scale bar
- Divide the actual diagram size by the measurement written on the scale bar.
For example
- length of scale bar is 20mm
- this is 20 000 µm
- so the magnification is 20 000 / 10 = X2000
Practical 2 - Estimation of osmolarity in tissues
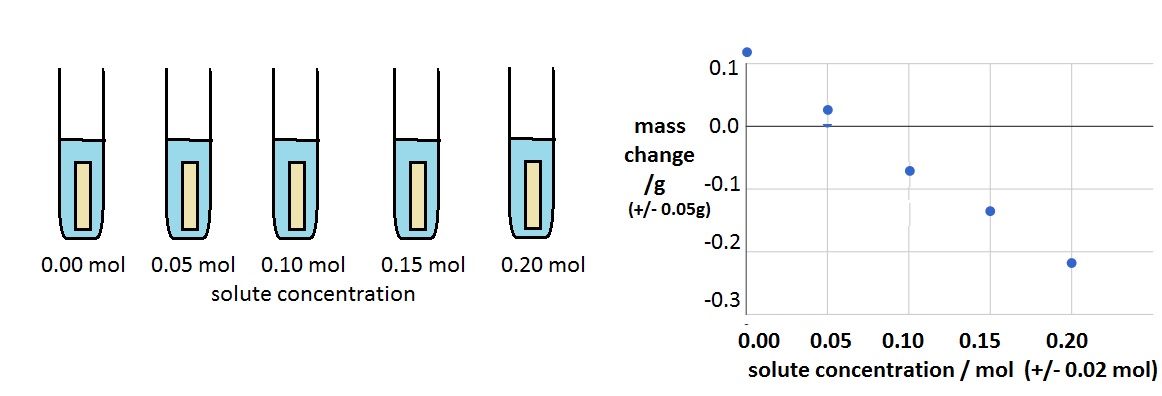
In a simple experiment five cyllinders of potato were soaked in five solute concentrations as shown below.
Use the graph to estimate the solute concentration of the cytoplasm of the potato cell cytoplasm.
How to do an estimate of the cytoplasm concentration.
- When the solution is the same as the cytoplasm concentration there will be no change in mass.
- Draw a best ft line on the graph and estimate where it crosses the 0.0 mass change.
- This is about 0.07 mol.
Practical 2 - Estimation of osmolarity in tissues
In a simple experiment five cyllinders of potato were soaked in five solute concentrations as shown below.

List the factors which must be controlled to make the experiment a reliable fair test.
Other factors which could affect the rate of osmosis could be:
- temperature
- the time allowed for diffusion
- shape of the potatoe cyllinders
- type of potato
- skin on the potato
- checking that all the salt has dissolved in the solution
Practical 2 - Estimation of osmolarity in tissues
In a simple experiment five cyllinders of potatoe were soaked in five solute concentrations as shown below.

Explain what the figures +/-0.05g and +/-0.02mol indicate on the graph axes.
These values show the uncertainty or the measurement.
+/- 0.05g means that a reading of 0.10g could be as little as 0.05g or as much as 0.15g.
(The axis scale really should also have 2d.p. so that it matches the uncertainty)
It is certain to be in between these values but we cannot know more precicely, because of the measuring equipment used.
The same logic can be applied to the concentration values. 0.10 mol could be 0.08 - 0.12 mol
Both of these 'uncertainties' are quite small, much smaller than the differences between concentrations shown on the graph, so we can infer that the data presented is quite reliable.
Practical 4 - Separating photosynthetic pigments by chromatography.
A biologist extracted green pigments from a crushed leaf. The pigments extracted were placed on the base line of some chromatogtaphy paper and a solvent ran up the paper revealing the three pigments as shown in the diagram below.
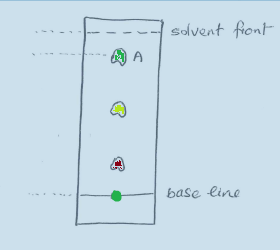
Explain why the pigments each moved different distances.
There are two forces acting on the pigments during the chromatography:
- The pigments adhere to the paper
- The pigments are carried by the solvent
Because each pigment is made from a different molecule the forces are different.
Molecules which adhere to the paper very strongly don't move very far, those which only attach lightly to the paper move further.
Smaller molecules tend to get carried further by the solvent, as do those which dissolve more easily in the solvent.
The distance a pigment travels depends on the paper, the solvent and these forces.
Practical 4 - Separating photosynthetic pigments by chromatography.
A biologist extracted green pigments from a crushed leaf. The pigments extracted were placed on the base line of some chromatogtaphy paper and a solvent ran up the paper revealing the three pigments as shown in the diagram.
An Rf value (retardation factor) can be calculated for a pigment which helps its identification.
\(Rf = {distance .traveled .by .pigment \over distance.traveled. by. solvent. front}\)
Known Rf values for this equipment are:
- carotene - 0.91
- chlorophyll a - 0.57
- chlorophyll b - 0.40
- pheophytin - 0.79
Calculate the rf value of pigment A and suggest a name for this pigment.
Distance of solvent front from the base line = 33 mm
Distance of the centre of pigment A from the base line = 29 mm
Rf value = 29 / 33 = 0.88
The closest pigment to the Rf value of 0.88 is Carotene with an Rf value of 0.91.
Practical 3 - Investigation of a factor affecting enzyme activity
This apparatus was used to investigate how pH can change the rate of an enzyme controlled reaction.
The source of catalase was a piece of liver. pH buffer solutions were added to the test tube.
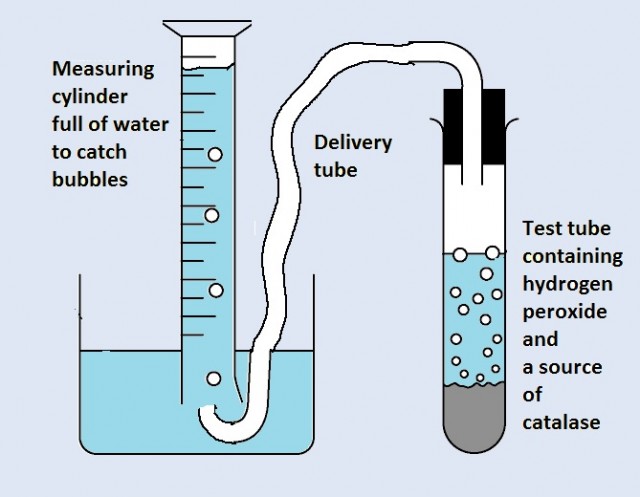
Explain how you would set up an investigation of pH using buffer solutions.
- How many different buffer solutions would you use, and which pH values?
- How many repeats of each measurement would you need?
- Why would a student need to consider the surface area, and the shape of the liver as well as its mass?
In order to see any pattern in the results there needs to be a range of buffer solutions covering pH5 to pH9 at least. A wider range would be better. This experiment would have 5 different pH values tested, pH5,6,7,8, and 9.
Each pH would need several repeats to check the reliability of the results. Three repeats would usually be sufficient.
The enzymes from the liver will contact the hydrogen peroxide on it's surface only. So although mass is important so will be shape as this will change the surface area if it is different.
Practical 3 - Investigation of a factor affecting enzyme activity.
This apparatus is used to test the rate of respiration with some insect larvae.
Respiration is a metabolic pathway controlled by enzymes, so the data gives us some information about the factors which affect enzymes.
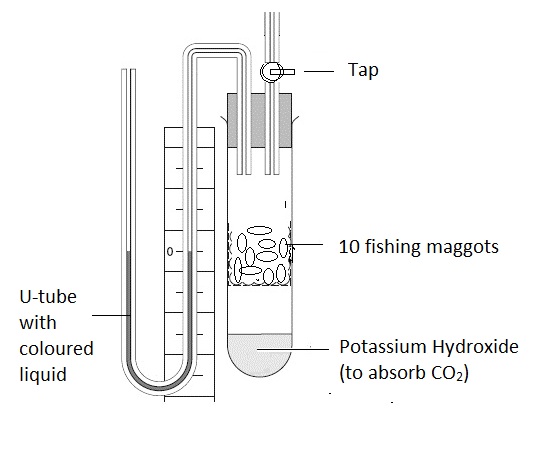
In an experiment to test the affect of temperature on enzyme controlled reactions a student wants to do experiments at five different temperatures, 0°C, 20°C, 40°C, 60°C and 80°C.
The teacher stopped the experiment because it was breaking the IB guidelines on animal experiments.
What is wrong with the plan? Explain why and suggest a better way to carry out the experiment.
The IB guidelines state that animals should not be subjected to conditions outside the range of conditions they experience in nature. It is very likely that 80°C, and 60°C will cause harm, or kill the maggots.
It would be better to test the maggots at 5 temperatures between 10°C and 40°C.
Practical 5 - Attempting to create a sealed microcosm
The diagram shows a simple meoscosm made by some students
.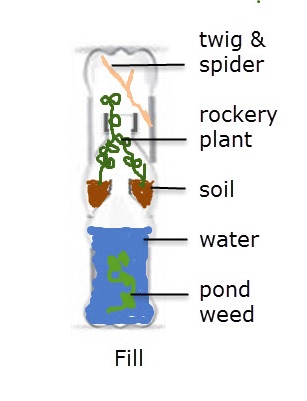
Outline some of the practical difficulties you might encounter in the construction of such a mesocosm, and suggest some precautions which might be taken to avoid harm to students or the animals in the mesocosm.
There are lots of practical difficulties:
- Cutting the bottles is a bit dangerous and you must hold the bottle in such a way that you cannot stab you hand with the scissors as you make the first cut into the bottle.
- The edges of the bottle must be the same size, and neatly cut to ensure a good seal.
- If you use a glue gun there is a need to be careful not to burn yourself.
- Putting the soil in without dropping too much into the water is tricky unless you have a long spoon / spatula.
- Care must be taken to ensure that there is enough photosynthesis to provide oxygen for the spider.
Pond weed is a good idea as it is likely to survive well, given enough light.
Practical 5 - Attempting to create a sealed microcosm
The photo shows a simple meoscosm made by some students
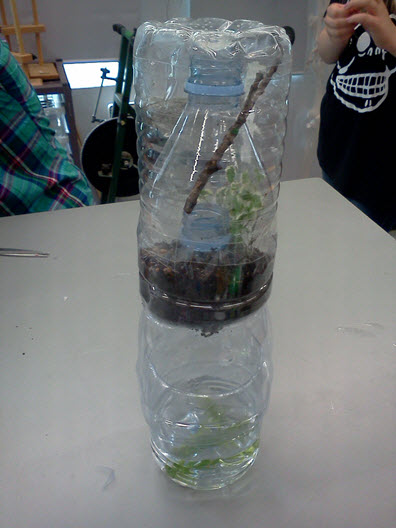
Suggest how this mesocosm could be used to investigate how the number of hours of light in a 24 hour period affects the balance of plants and animals in the mesocosm.
This is really a question about experiment design.
There would need to be five identical mesocosms each containing the same organisms.
Each mesocosm would be given a different lighting regime
(e.g. 4 ours / day, 8 hours /day, 12 hours /day, 16 hours and 20 hours.)
A measure of the number of animals, and plants after a period of several weeks would be recorded.
Measurements could be taken each week for a couple of months, or even longer.
For more reliable results more mesocosms would be needed so there could be repeats.
Practical 7 - Measurement of transpiration rates using potometers
This graph shows the changes in the rate of transpiration for an experiment with different humidities.
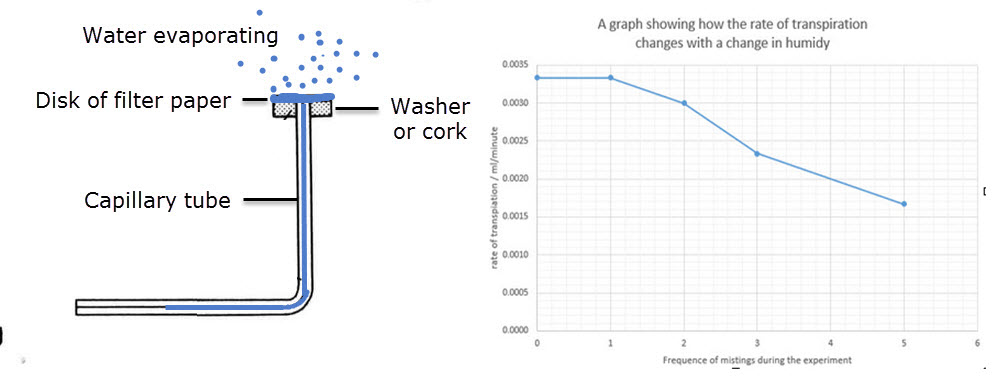
What measurements would have to be taken using the apparatus above in order to calculate the "rate of transpiration" shown in the graph?
How would you calculate the rate of transpiration.
What problems would occur if a bubble of water was left underneath the disk of filter paper?
The movement of the water in the capillary tube would been measured using the apparatus.
The time taken for the movement.
The rate would be calculated by dividing the movement by the time taken.
Better still the volume of water evaporated divided by the time taken.
If there was a bubble of water under the filter paper then the bubble would expand in size and the water in the capillary tube would not move.
Practical 6 - Monitoring of ventilation at rest, after mild & vigorous exercise
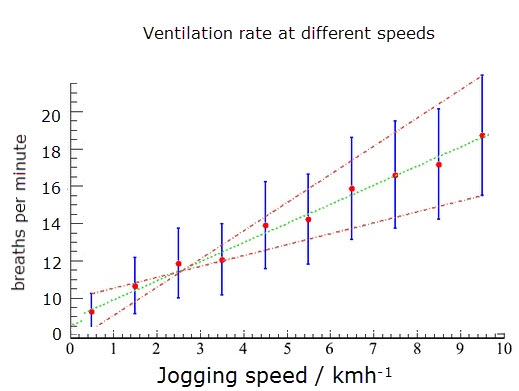
This graph shows the results of an experiment to measure ventilation rates at different joggin speeds.
The red dots show the average rate and the blue bars show the range of readings taken.

- Describe how the ventilation rate changes as the jogging speed increases.
- Suggest what you would expect to happen to the volume of each breath as the jogging speed increased.
As the jogging speed increases the ventilation rate increases at a constant rate.
There is a possitive correlation between joggins speed and ventilation rate.
The depth of each breath would also increase (especially at slower jogging speeds)
There is a limit to the volume of a breath, the tidal volume of the lungs.

 IB Docs (2) Team
