Modelling energy flow
 This activity builds on the SL Ecology topic 'Energy in food chains'. Food chains show species in Trophic levels and multiple food chains usually exist within a community, shown by a food web. The most important concept with such diagrams is the flow of energy. This activity uses pyramids of energy and energy flow diagrams to illustrate the differences in conversion ratios between grasshoppers and mammals like cows and rabbits. Students are expected to comparison and explain the pyramids of energy from different ecosystems.
Lesson Description
Guiding Question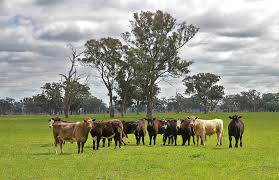
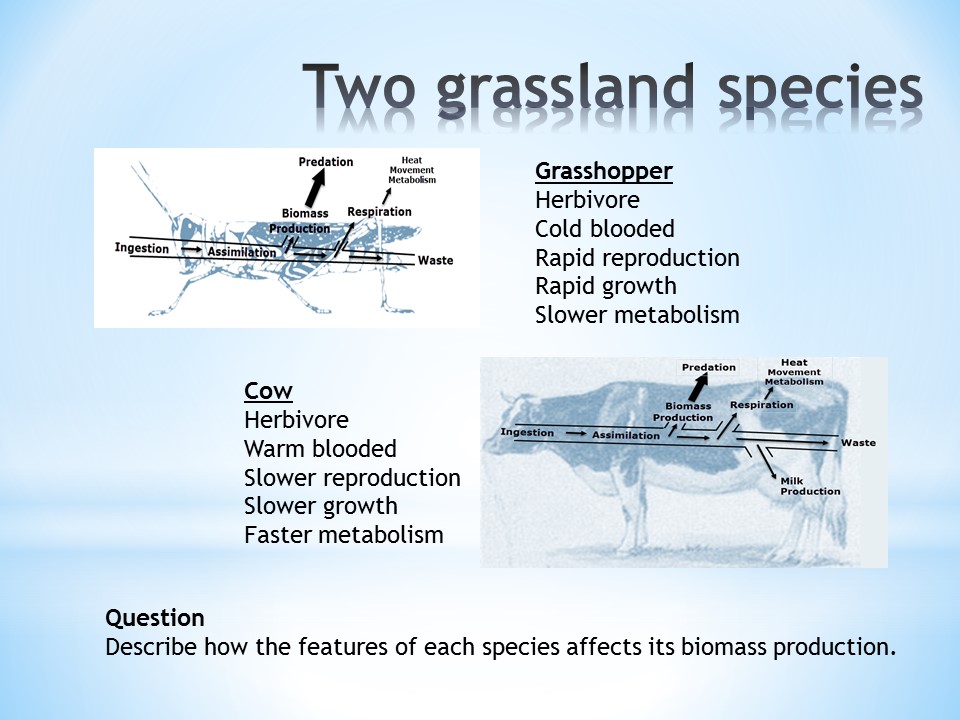
There are many differences between insects and cattle.
The film in Activity 1 suggests that farming insects is more efficient than farming beef. Why do you think this is?
Activity 1 - Eating insects can save the world.
Watch the first interview on this BBC video (from 6 minutes to 9:30) and consider the questions below;
Can Eating insects save the world?
Questions
- Why is the United Nations FAO interested in getting people to eat insects?
- List three of the beneficial qualities of including insects in your diet.
- Why can we claim that insects have a low carbon footprint?
Answers
- Why s the United Nations FAO interested in getting people to eat insects?
It could be a way to help solve the world food crises.
Compared to beef farming, insects are 20 times more efficient to produce.
Insects are a good source of protein and
Finding alternative sources of protein for the growing world population will be important in the future.
- How is the farming of insects more efficient that beef?
Insects are equally high in protein
Insects reproduce rapidly
Insects produce a lot of body mass quickly using little food.
Insects require much less water than beef.
- Why can we claim that insects have a low carbon footprint?
They produce few greenhouse gases.
They are cold blooded - poikilotherms (animals that have a variable body temperature) which are more effective producers of protein. - don't waste energy keeping warm.
Extension activity
Read this short article about the Environmental opportunities of insect farming.
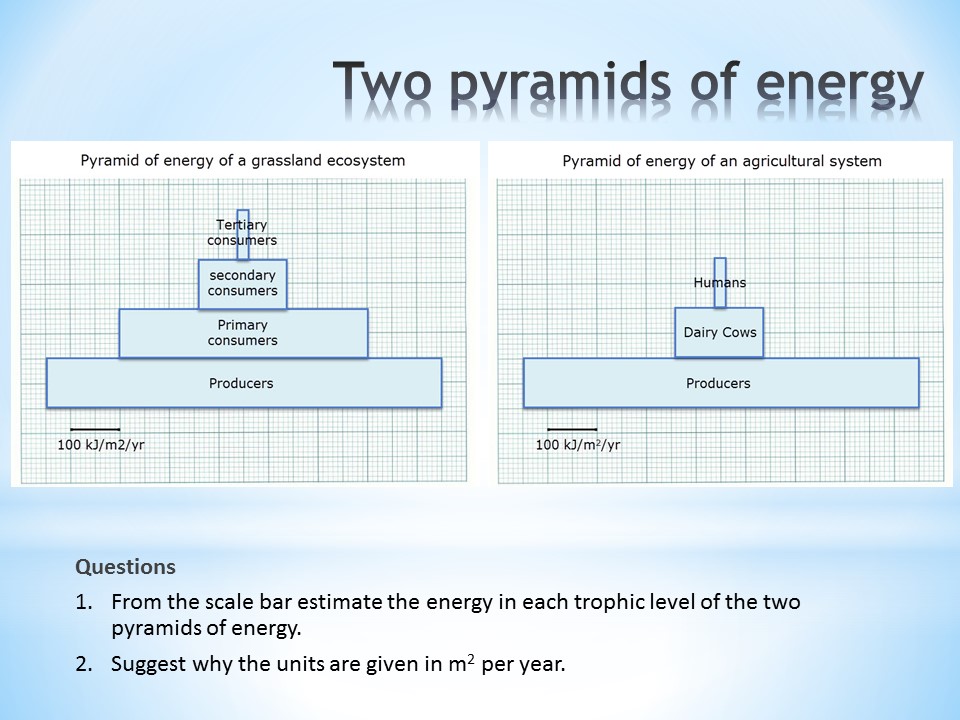
Activity 2 - Comparing pyramids of energy
There are many differences between insects and beef cattle.
The film in Activity 1 suggests that farming insects is more efficient than farming beef.
Why is this?
Review the following slides and answer the questions on the worksheet below.
Grassland food webs:
Grassland food webs:
Grassland food webs:
Grassland food webs:
Grassland food webs:
Grassland food webs:
Compare the questions on the student worksheet Energy flow in grasshoppers.
Activity 3 - The influence of Respiration on the Conversion ratio
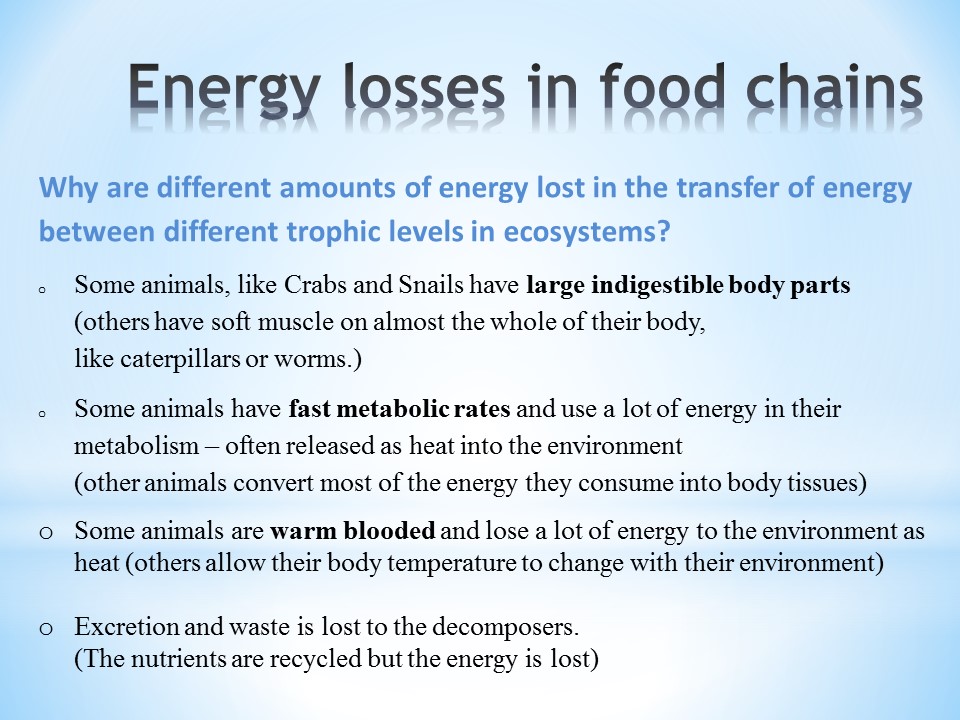
The respiration rate has an important influence on the percentage of ingested energy which gets converted to biomass.
The more respiration there is then the less energy there is available to the predators (net production).
Introduction
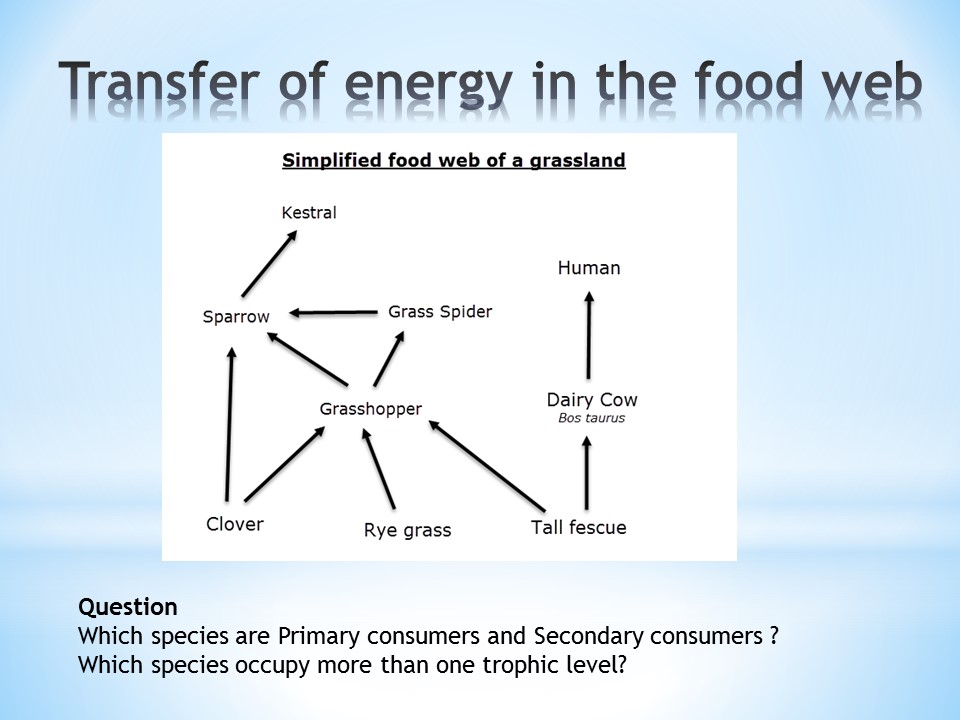
The diagram shows a typical grazing food chain. Energy is trapped by primary producers (autotrophs) through photosynthesis and then moves up the trophic levels to primary consumers then to secondary and tertiary consumers.
Questions
1. Explain why the sizes of the square boxes representing the biomass in each trophic level changes as you move from producers to "top c." tertiary consumers gets smaller.
..................................................................................................................................................................
2. Where does most of the unused ( and unassimilated) energy go in your biomass pyramid ?
..................................................................................................................................................................
Click the eye icon to display suggested answersAnswers
1. Explain why the sizes of the square boxes representing the biomass in each trophic level changes as you move from producers to "top c."tertiary consumers gets smaller.
Energy is lost at each successive trophic level because of respiratory losses,heat losses, and unassimilated (i.e., feces, etc.) and unused (i.e., litter) energy.
2. Where does most of the unused ( and unassimilated) energy go in your biomass pyramid ?
Unused and unassimilated energy enters the detritivore food web in the form of dead organic matter.
The dead organic matter is decomposed by organisms releasing energy to the environment, and recycling nutrients.
In closed ecosystems energy but not matter is exchanged with the surroundings.
Answer the following IB style questions on ecosystem energy flow
Teacher's notes
This activity tries to combine ideas about the energy flow in food chains and pyramids of energy with the suggestion that conversion ratios may help agriculture to be more productive, which could provide part of a solution for the looming word food crisis.
Activity one introduces the idea that eating insects requires a lower energy than eating cattle or other animals.
The short video gets students interested in the idea. There are some links to the Ecology topic especially with the idea of sustainable agriculture and the greenhouse effect.
Activity two contains some slides which can be used in a classroom presentation by the teacher or by students themselves. The student worksheet and the questions go into some depth about the different fates of energy in each trophic level of food webs. Pyramids of energy were drawn in topic 5 Ecology so this activity describes the differences between them and uses the graphs to calculate the conversion ratio. Tables of data have not been given, so it may be good to produce them while calculating the F.C.R. and it would also be good to explain the units of energy.
There are some modle answers for these questions here:Grasshoppers questions model answers
Activity three is an opportunity to look at a different energy flow diagram, there are many different variants in the ecological literature. Students are asked to describe some differences and explain the reasons for them.
Poikilotherms (animals that have a variable body temperature) are more effective producers of protein than homeotherms (animals that maintain a regulated body temperature) as they have a higher rate of conversion of food to biomass.
There are some modle answers for these questions here:Energy flow - IB style qns - Model answers