 IB Docs (2) Team

Ecology mini investigation
What does an Individual investigation look like? Students will try out all the steps of the planning and carrying out of the individual investigation in a collaborative group work task. For each aspect of the Internal assessment there is a short introductory task and a model of how this might look in a completed investigation.
Each section of this activity addresses an important aspect of the individual investigation.
Carry out the instructions and complete the relevant part of the activity sheet shown below.
Lesson Description
Guiding Questions
What does an Individual investigation look like?
What steps does a Biologist take to find the answer to a "Research question"?
What are the essential parts of a good research question?
Activity 1 - Planning an experiment to answer a question
Do you ever look around you and think, "why does that happen, like that?"
Normally this is exactly the sort of observation which could lead you to an individual investigation.
In the IA you have to choose your own topic to investigate, in this mini investigation the topic of investigation is based on an observation made by a student several years ago.
Curious observation
Why is the grass all different lengths in the school grounds, when the grounds maintenance team always cut all the grass on the same day. What could be causing the grass, and the other plants in the school field, to grow faster in some places?
Choose the best research question from these three options
All of them would be possible research questions, which is best?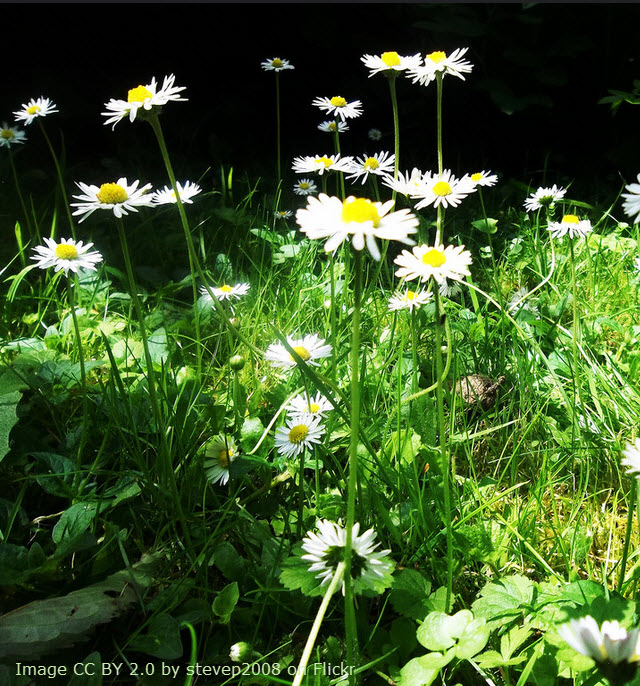
- Do grass species in our school grounds grow faster in places where the soil is deeper?
- Why do plants in the school grounds grow faster in some places?
- Does a specific grass species (Binomial name) in the school grounds grow faster if the soil is deeper?
This page has further details about Focusing a research question for an IB Biology individual investigation.
Explain why you chose your preferred question.
...........................................................................................................................
...........................................................................................................................
Suggested reasons why #3 is the best research question
- Do grass species in our school grounds grow faster in places where the soil is deeper?
This is OK, but 'grass species' could be more focused, some species of grass are faster growing because their genome is better adapted for fast growth. To test all species of grass would overlook a variable which could be controlled. - Why do plants in the school grounds grow faster in some places?
This is the worst research question of the three. It asks the question, "why?" but there is no mention of a specific variable, and the "plants" are also likely to grow at different speeds depending on their species. - Does a specific plant species (Binomial name) in the school grounds grow faster if the soil is deeper?
This is the best of the three research questions, there is a species named and the independent variable is identified as "soil depth".
Background information
An important section of the investigation is the 'background information'.
This is really a biological introduction to the research question and should be relevant to the research question.
A good approach is to look for information in three ways;
- Which topics in the IB Biology course are relevant to the research question?
...................................................................................................................................
................................................................................................................................... - What factors could cause the dependent variable to be bigger?
...................................................................................................................................
................................................................................................................................... - How can the independent variable affect the dependant variable.
...................................................................................................................................
...................................................................................................................................
Suggested answers
Information about photosynthesis, and transpiration in plants.
Growth of plants and hormones.
Structure and function of leaves,
Adaptation of plants
Test variables
It is not necessary to list variables, but if they are not clearly stated in the background, then it is worth listing them in a separate section. Ideally this should be the independent variable and the dependent variable.
Independent variable ..............................................................................................................................
Dependent variable ................................................................................................................................
Controlled Variables
This is a crucial section. If there are not sufficient controlled variables then the methodology is in danger.
Which other variables could affect the dependent variable, the height of the chosen plant species?
...................................................................................................................................
...................................................................................................................................
...................................................................................................................................
...................................................................................................................................
Suggestions of controlled variables
Soil depth
Shading / Light intensity
Watering regime
Temperature
How much data?
It is best to begin with a sketch graph of the results. How many points will be needed in the graph?
As a rule of thumb, never fewer than three repeats, and always at least five values of the independent variable.
Sometimes a comparison can be made between two sites, but in this case ten repeats per site would be advisable.
Draw a sketch graph of the results:
.
.
Make a note of how many points and repeats you have included. Remember to mention these in the method.
...................................................................................................................................
...................................................................................................................................
Safety, Ethics, Disposal of waste
What safety measures will be required while collecting this data?
Think of weather conditions, clothing, environmental damage, and risks from working with quadrat frames.
...................................................................................................................................
...................................................................................................................................
Suggestions of safety and Environmental considerations.
Pay attention to the weather forecast when working outside and wear suitable clothing / sun screen / waterproofs etc.
Take care not to cause damage to the study site while doing the study, e.g. don't walk on flowers, dig holes etc.
Activity 2 - Write up the first half of the Field Experiment
Students use their answers to the questions from activity 1 to complete the Introduction sections of the mini-investigation using the following ![]() Outline headings for mini-investigation (checklist).
Outline headings for mini-investigation (checklist).
Replace the notes and suggestions with the information about the investigation.
Title Don’t do a title page, just a simple title
Aim
Say what the topic of the investigation is all about
Research Question
State a focused research question
Introduction
- Biological background information
- Variables (DV & IV)
- Controlled variables during the experiment
- Null Hypothesis H0 and Alternative hypothesis H1 (for statistics)
- Safety, Ethics, Disposal of waste
Activity 3 - Carry out the mini ecology investigation data collection
Use some good student work or a class plan of the experiment from Activity 2.
Alternatively use this ![]() Short model method, for the Mini ecology experiment
Short model method, for the Mini ecology experiment
Activity 4 - Analysis of data
Here is some sample data from a simple experiment which finds a weak correlation between soil depth and plant height.
Ecology mini investigation data to analyse for a correlation. ![]() Mini ecology investigation to analyse for correllation
Mini ecology investigation to analyse for correllation
An alternative set of data here is useful for analysis of the data if it is two averages. ![]() Mini ecology investigation to analyse with a t-test
Mini ecology investigation to analyse with a t-test
Teacher's notes
This whole activity provides some resources to walk students through the planning, carrying out and writing up of an investigation. It is expected that some explanation will be required and every teacher will have their own way to do this.
The example answers and the documents are simpler than an IA needs to be. Students should be warned that the final write-up should be 10 to 12 pages long, and each of the sections illustrated here will be longer and more detailed in their write up.
However the check list does show the required sections and the bullet points cover the main details required.
The analysis examples show correlation and a comparison between two averages. A T-Test is quite good for this second example. A chi-squared test might also be used, but this would need a null hypothesis and a set of observed and expected values.
This activity might be useful for the illustration of a chi-squared test in the analysis?
This is a nice research paper about an ecological study which included chi squared analysis: Direct and indirect associations between plant species richness and productivity in grasslands: regional differences preclude simple generalization of productivity-biodiversity relationships
 Twitter
 Facebook
 LinkedIn