Transverse & Longitudinal Waves
- In mechanical waves, particles oscillate about fixed points
- There are two types of wave: transverse and longitudinal
- The type of wave can be determined by the direction of the oscillations in relation to the direction the wave is travelling
Transverse Waves
- Transverse waves are defined as follows:
A wave in which the particles oscillate perpendicular to the direction of motion and energy transfer
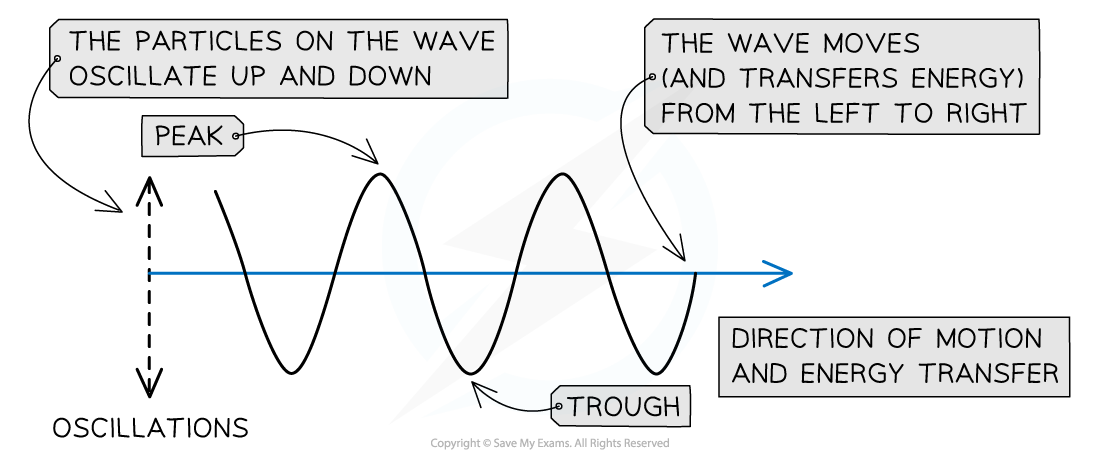
A transverse wave travelling from left to right
- Transverse waves show areas of peaks and troughs
- Examples of transverse waves include:
- Electromagnetic waves e.g. radio, visible light, UV
- Vibrations on a guitar string
- Transverse waves do not need particles to propagate, and so they can travel through a vacuum
Longitudinal Waves
- Longitudinal waves are defined as follows:
A wave in which the particles oscillate parallel to the direction of motion and energy transfer
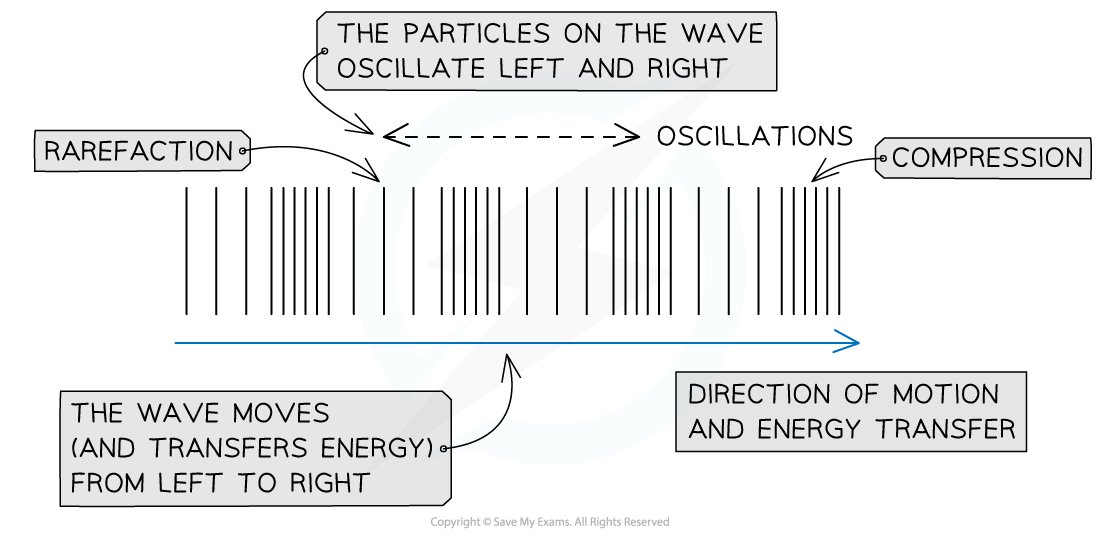
A longitudinal wave travelling from left to right
- As a longitudinal wave propagates, areas of low and high pressure can be observed:
- A rarefaction is an area of low pressure, with the particles being further apart from each other
- A compression is an area of high pressure, with the particles being closer to each other
- Sound waves are an example of longitudinal waves
- Longitudinal waves need particles to propagate, and so they cannot travel through a vacuum
Worked Example
The diagram below represents a transverse wave at time t = 0. The direction of motion of the wave is shown. Point P is a point on the wave. State in which direction point P will move immediately after the time shown.

Step 1: Determine the possible directions that point P can travel in
- In transverse waves, the particles oscillate perpendicular to the direction of motion
- This transverse wave travels from right to left
- Oscillations will either be up or down
- Hence point P will either move up or down
Step 2: Determine the next direction of point P
- Since the wave is moving from right to left, a crest (i.e. a point of maximum displacement above the equilibrium position) will be approaching point P immediately after the time shown
- Point P will be moving upwards
Transverse & Longitudinal Graphs
- Two different types of graphs can be used to represent a travelling wave:
- Displacement-distance graphs, with displacement x (m) on the y-axis and distance d (m) on the x-axis
- Displacement-time graphs, with displacement x (m) on the y-axis and time t (s) on the x-axis
- Both transverse and longitudinal waves can be shown on these graphs
Displacement-Distance Graphs
- A displacement-distance graph is also known as a wave profile
- It represents the displacement of many particles on the wave at a fixed instant in time (e.g. t = 0)
- A displacement-distance graph directly provides:
- The amplitude A of the wave
- The wavelength λ of the wave
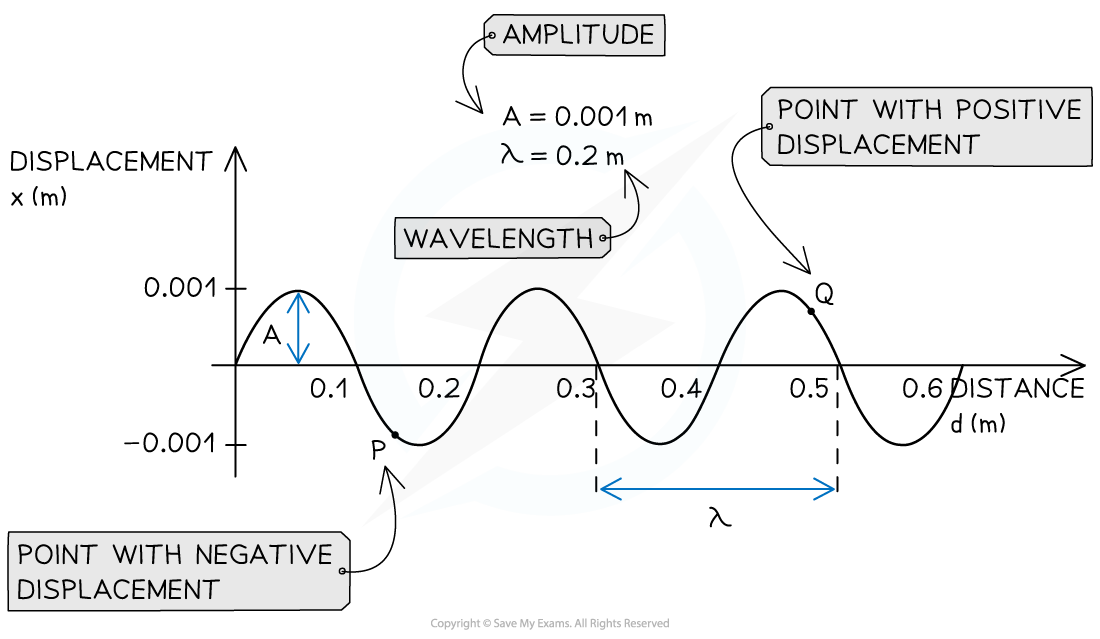
An example of displacement-distance graph for a travelling wave
- In the displacement-distance graph of a transverse wave moving in the horizontal direction:
- Particles with positive displacement are those moving up
- Particles with negative displacement are those moving down
- In the displacement-distance graph of a longitudinal wave moving in the horizontal direction:
- Particles with positive displacement are those moving to the right
- Particles with negative displacement are those moving to the left
- The wavelength in a longitudinal wave can be figured out from the distance between two rarefactions (or two compressions)
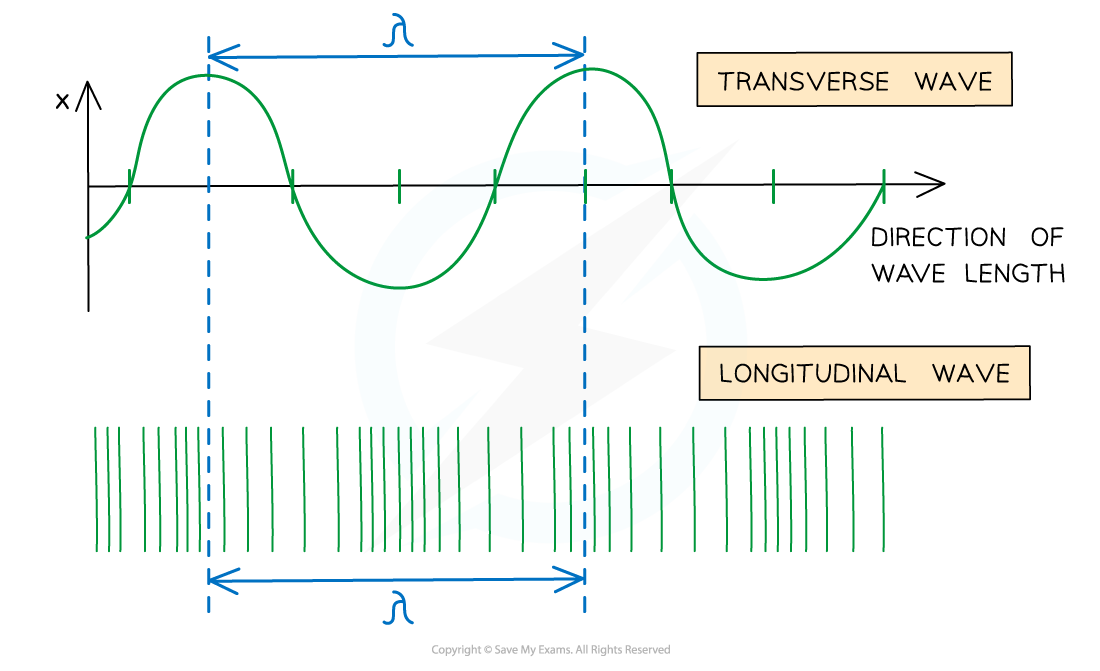
A wavelength on a longitudinal wave is the distance between two compressions or two rarefactions
Displacement-Time Graphs
- A displacement-time graphs represents the variation of the displacement of one particle with time
- A displacement-time graph directly provides:
- The amplitude A of the wave
- The period T of the wave
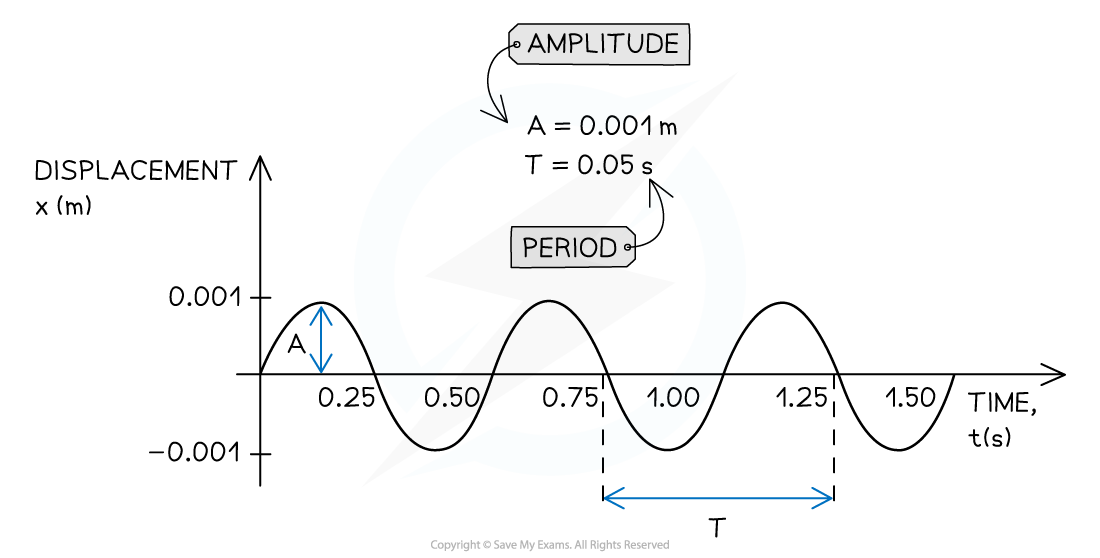
An example of displacement-time graph for a travelling wave
Worked Example
Below is the displacement-time graph for a light wave travelling at 3 × 10⁸ m s–1.

Determine:
(i) The period of the wave in seconds (s)
(ii) The wavelength of the wave in metres (m)
(i) Determine the period T directly from the displacement-time graph
-
- Recall that period is defined as the time taken for one complete oscillation
- Note that you must convert the period from milliseconds (ms) into seconds (s)

T = 2 × 10⁻³ s
(ii) Determine the wavelength of the wave in metres
Step 1: Write down the relationship between frequency f and period T
![]()
Step 2: Substitute the value of the period determined in Step 1 into the above equation
![]()
f = 500 Hz
Step 3: Write down the wave equation
c = fλ
Step 4: Rearrange the above equation to calculate the wavelength λ
![]()
Step 5: Substitute the velocity c = 3 × 10⁸ m s–1 and the frequency f calculated in Step 2
![]()
λ = 6 × 10⁵ m
Exam Tip
When approaching a question, pay attention to the label on the x-axis of the graph.
- The distance between two adjacent crests (or troughs) on a displacement-distance graph is equal to the wavelength λ of the wave
- The distance between two adjacent crests (or troughs) on a displacement-time graph is equal to the period T of the wave
Remember to look at the units of measure on both axes of the graph, and convert units if needed.
The speed of any electromagnetic wave is equal to the speed of light, c = 3 × 10⁸ m s–1
