Exponential Discharge of a Capacitor
Charging
- Capacitors are charged by a power supply (eg. a battery)
- When charging, the electrons are pulled from the plate connected to the positive terminal of the power supply
- Hence the plate nearest the positive terminal is positively charged
- They travel around the circuit and are pushed onto the plate connected to the negative terminal
- Hence the plate nearest the negative terminal is negatively charged
- As the negative charge builds up, fewer electrons are pushed onto the plate due to electrostatic repulsion from the electrons already on the plate
- When no more electrons can be pushed onto the negative plate, the charging stops
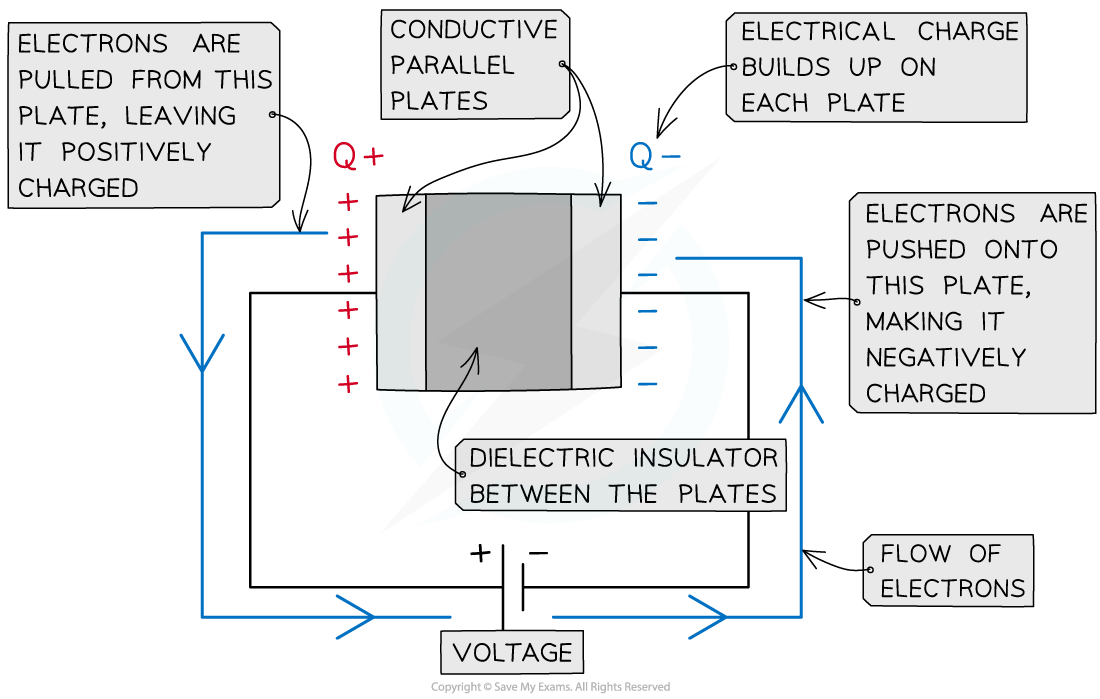
A parallel plate capacitor is made up of two conductive plates with opposite charges building up on each plate
- At the start of charging, the current is large and gradually falls to zero as the electrons stop flowing through the circuit
- The current decreases exponentially
- This means the rate at which the current decreases is proportional to the amount of current it has left
- Since an equal but opposite charge builds up on each plate, the potential difference between the plates slowly increases until it is the same as that of the power supply
- Similarly, the charge of the plates slowly increases until it is at its maximum charge defined by the capacitance of the capacitor
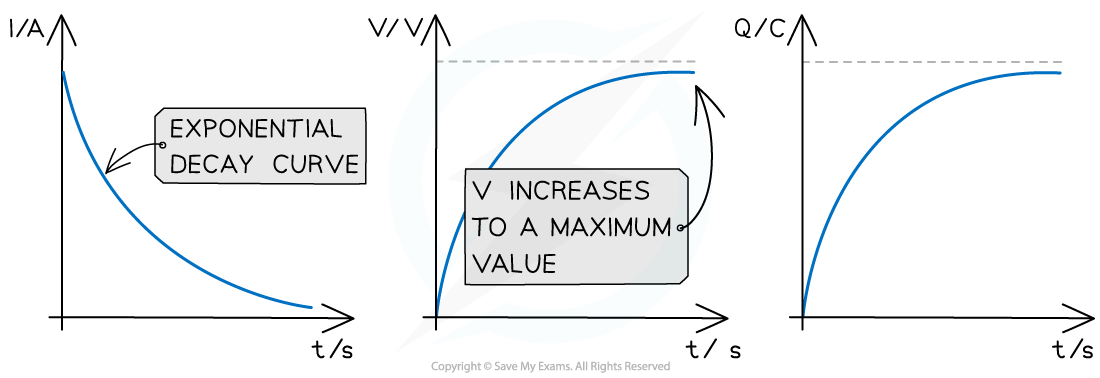
Graphs of variation of current, p.d and charge with time for a capacitor charging through a battery
- The key features of the charging graphs are:
- The shapes of the p.d. and charge against time graphs are identical
- The current against time graph is an exponential decay curve
- The initial value of the current starts on the y axis and decreases exponentially
- The initial value of the p.d and charge starts at 0 up to a maximum value
Discharging
- Capacitors are discharged through a resistor with no power supply present
- The electrons now flow back from the negative plate to the positive plate until there are equal numbers on each plate and no potential difference between them
- Charging and discharging is commonly achieved by moving a switch that connects the capacitor between a power supply and a resistor
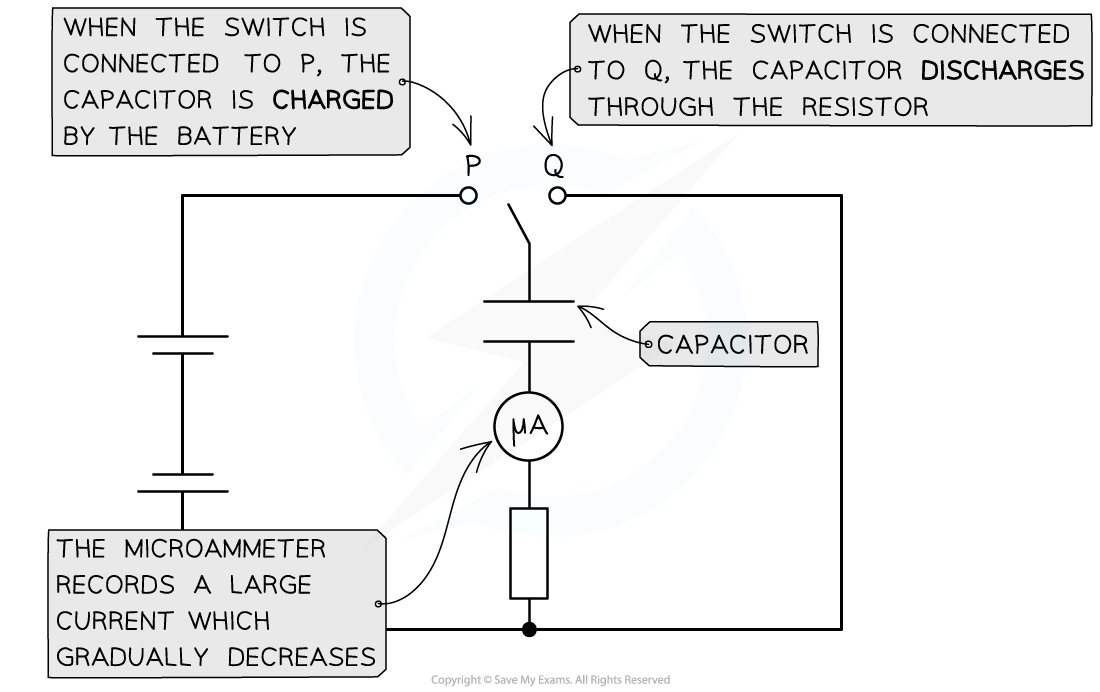
The capacitor charges when connected to terminal P and discharges when connected to terminal Q
- At the start of discharge, the current is large (but in the opposite direction to when it was charging) and gradually falls to zero
- As a capacitor discharges, the current, p.d and charge all decrease exponentially
- This means the rate at which the current, p.d or charge decreases is proportional to the amount of current, p.d or charge it has left
- The graphs of the variation with time of current, p.d and charge are all identical and follow a pattern of exponential decay

Graphs of variation of current, p.d and charge with time for a capacitor discharging through a resistor
- The key features of the discharge graphs are:
- The shape of the current, p.d. and charge against time graphs are identical
- Each graph shows exponential decay curves with decreasing gradient
- The initial values (typically called I0, V0 and Q0 respectively) start on the y axis and decrease exponentially
- The rate at which a capacitor discharges depends on the resistance of the circuit
- If the resistance is high, the current will decrease and charge will flow from the capacitor plates more slowly, meaning the capacitor will take longer to discharge
- If the resistance is low, the current will increase and charge will flow from the capacitor plates quickly, meaning the capacitor will discharge faster
Properties of Capacitor Discharge Graphs
- From electricity, the charge is defined:
ΔQ = IΔt
- Where:
- I = current (A)
- ΔQ = change in charge (C)
- Δt = change in time (s)
- This means that the area under a current-time graph for a charging (or discharging) capacitor is the charge stored for a certain time interval
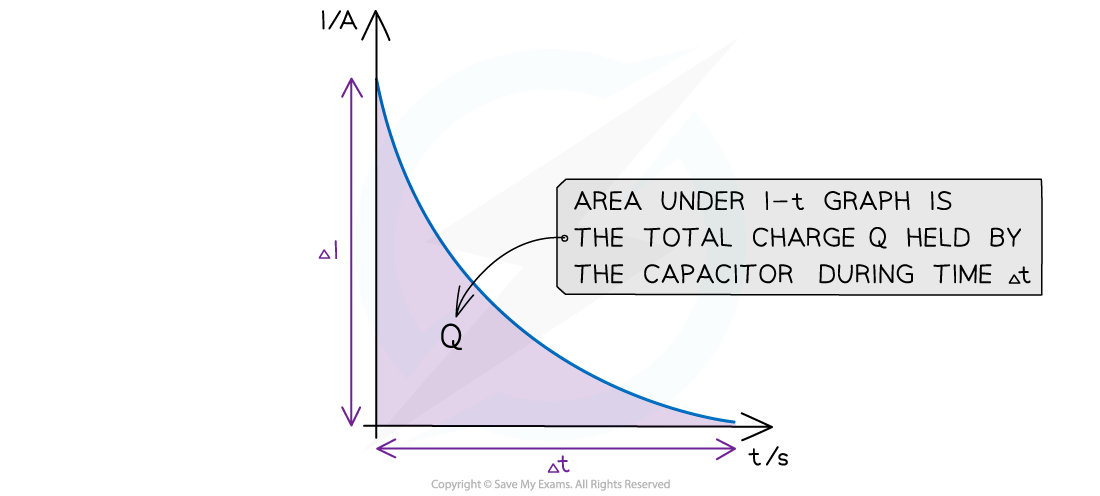
The area under the I-t graph is the total charge stored in the capacitor in the time interval Δt
- Rearranging for the current:

- This means that the gradient of the charge-time graph is the current at that time
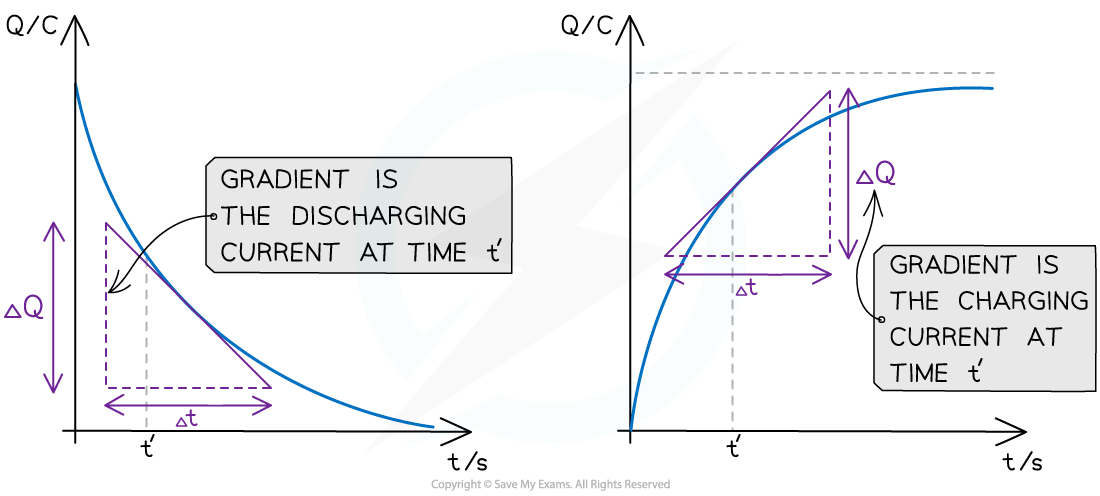
The gradient of a discharging and charging Q-t graph is the current
- In the discharging graph, this is the discharging current at that time
- In the charging graph, this is the charging current at that time
- To calculate the gradient of a curve, draw a tangent at that point and calculate the gradient of that tangent
Worked Example
The graph below shows how the charge stored on a capacitor with capacitance C varies with time as it discharges through a resistor. 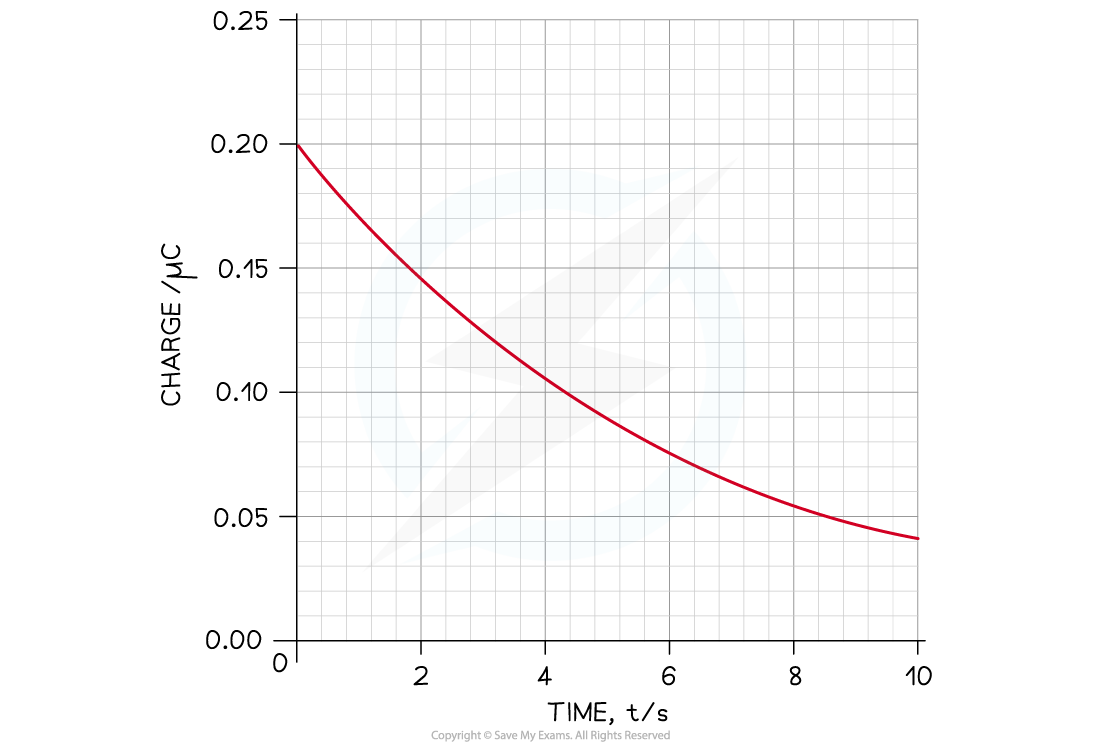 Calculate the current through the circuit after 4 s.
Step 1: Draw a tangent at t = 4
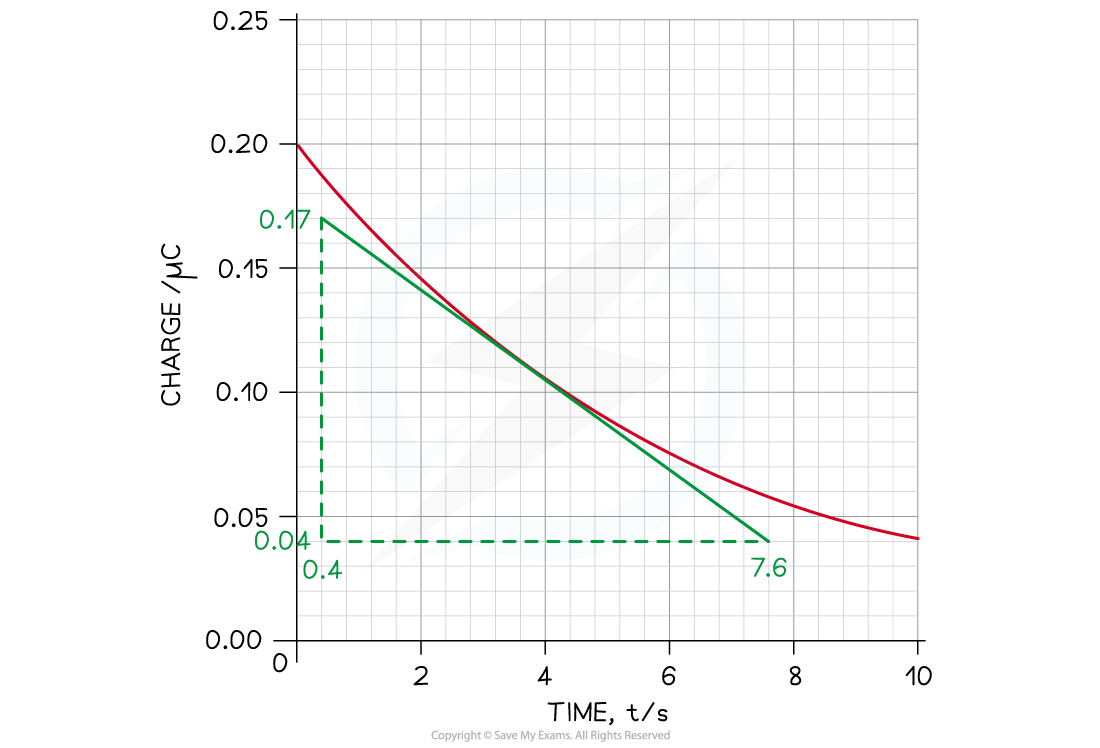
Step 2: Calculate the gradient of the tangent to find the current I

Exam Tip
Make sure you're comfortable with sketching and interpreting charging and discharging graphs, as these are common exam questions.
Remember that conventional current flow is in the opposite direction to the electron flow
