Calorimetry Experiments
- There are two types of calorimetry experiments you need to know for IB Chemistry:
- Enthalpy changes of reactions in solution
- Enthalpy changes of combustion
- In both cases you should be able to give an outline of the experiment and be able to process experimental data using calculations or graphical methods
Enthalpy changes for reactions in solution
- The principle of these calorimetry experiments is to carry out the reaction with an excess of one reagent and measure the temperature change over the course of a few minutes
- The apparatus needed to carry out an enthalpy of reaction in solution calorimetry experiment is shown in the previous section 5.1.3 Calorimetry
- For the purposes of the calculations, some assumptions are made about the experiment:
- That the specific heat capacity of the solution is the same as pure water, i.e. 4.18 J g-1 K-1
- That the density of the solution is the same as pure water, i.e. 1 g cm-3
- The specific heat capacity of the container is ignored
- The reaction is complete
- There are negligible heat losses
Temperature correction graphs
- For reactions which are not instantaneous there may be a delay before the maximum temperature is reached
- During that delay the substances themselves may be losing heat to the surroundings, so that the true maximum temperature is never actually reached
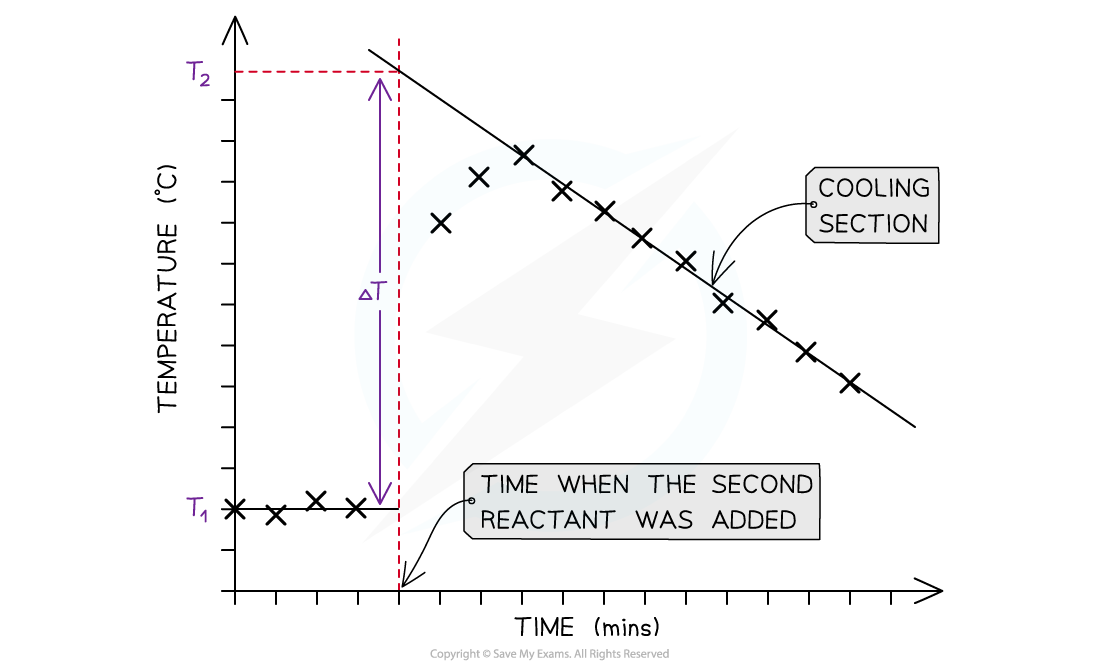
- To overcome this problem we can use graphical analysis to determine the maximum enthalpy change

A temperature correction graph for a metal displacement reaction between zinc and copper sulfate solution. The zinc is added after 4 minutes
The steps to make a temperature correction graph are:
- Take a temperature reading before adding the reactants for a few minutes to get a steady value
- Add the second reactant and continue recording the temperature and time
- Plot the graph and extrapolate the cooling part of the graph until you intersect the time at which the second reactant was added
- An assumption made here is that the rate of cooling is constant
- The analysis can also be used for endothermic reactions, but this time there will be a ‘warming’ section as the substances return to room temperature
Worked Example
Excess iron powder was added to 100.0 cm3 of 0.200 mol dm-3 copper(II)sulfate solution in a calorimeter. The reaction equation was as follows
Fe (s) + CuSO4 (aq) → FeSO4 (aq) + Cu (s)
The maximum temperature rise was 7.5 oC. Determine the enthalpy of reaction, in kJAnswer:
Step 1: Calculate q
q = m x c x ΔT
q = 100 g x 4.18 J g-1 K-1 x 7.5 K = - 3135 J
Step 2: Calculate the amount of CuSO4 (aq)
moles = volume in dm3 x concentration = 0.1 x 0.2 = 0.02 mol
Step 3: Calculate ΔH
ΔH = q ÷ n = -3135 J ÷ 0.02 mol = - 156 750 J = -156.75 kJ = -160 kJ (2 sig figs)
Enthalpy of Combustion Experiments
- The principle here is to use the heat released by a combustion reaction to increase the heat content of water
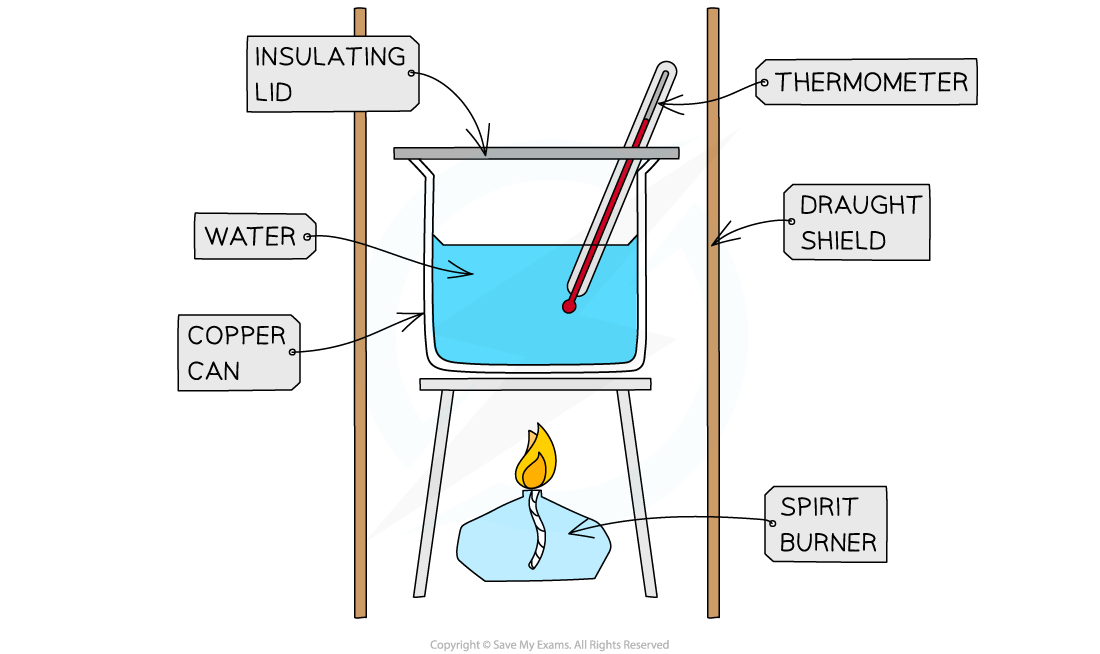
- A typical simple calorimeter is used to measure the temperature changes to the water

A simple combustion calorimeter
- Not all the heat produced by the combustion reaction is transferred to the water
- Some heat is lost to the surroundings
- Some heat is absorbed by the calorimeter
- To minimise the heat losses the copper calorimeter should not be placed too far above the flame and a lid placed over the calorimeter
- Shielding can be used to reduce draughts
- In this experiment the main sources of error are
- Heat losses
- Incomplete combustion
Worked Example
1.023 g of propan-1-ol (M = 60.11 g mol-1) was burned in a spirit burner and used to heat 200 g of water in a copper calorimeter. The temperature of the water rose by 30 oC.Calculate the enthalpy of combustion of propan-1-ol using this data.
Answer:
Step 1: Calculate q
q = m x c x ΔT
q = 200 g x 4.18 J g-1 K-1 x 30 K = - 25 080 J
Step 2: Calculate the amount of propan-1-ol burned
moles = mass ÷ molar mass = 1.023 g ÷ 60.11 g mol-1 = 0.01702 mol
Step 3: Calculate ΔH
ΔH = q ÷ n = -25 080 J ÷ 0.01702 mol = - 1 473 560 J = -1 474 kJ = -1.5 x 10³ kJ
Exam Tip
There are many potential sources of error in calorimetry experiments, both quantitative and qualitative. Determining % errors and comparing ΔH results to data book values is an important part of this topic and is covered in more detail in Topic 11 Measurement and Data Processing
