- C1 Species and communities
- C.2 Communities and ecosystems
- C.3 Impact of humans on ecosystems
- C4 Conservation of biodiversity
- C5 Populations - HL
- C6 Nutrient cycles - HL
- Exam style question on C1
- Model answer
- Exam style question on C2
- Model answer
- Exam style question on C3
- Model answer
- Exam style question on C4
- Model answer
- Exam style question on C5
- Model answer
- Exam style question on C6
- Model answer
- Drag and drop activities

This section explains the details which students are required to know.
There are understandings, skills and suggestions for revision questions.
C1 Species and communities
- Limiting factors affect the distribution of species.
- Keystone species affect community structure.
- The spatial habitat and interactions with other species gives each species a unique role within a community.
- Interactions between species in a community can be classified according to their effect.
-
Two species cannot survive indefinitely in the same habitat if their niches are identical. - Application: The symbiotic relationship between Zooxanthellae and reef-building coral reef species.
- Skill: Analysis of a data set that illustrates the distinction between fundamental and realized niche.
Revision Question(s)
- Which environmental factors can limit the range of a species of plants or animals?
- Every species has a unique role in its community - what aspects of its life do we need to describe to understand this?
- What sorts of relationships can affect the places where organisms are found?
- Can you think of an example of species which are more abundant when living together than they are living apart?
Skills ( can you ...)
- Use the distribution of one animal and one plant species to illustrate limits of tolerance and zones of stress.
- Use a transect to correlate the distribution of plant or animal species with an abiotic variable.
- Give local examples to illustrate the range of ways in which species can interact within a community.
C.2 Communities and ecosystems
- Food chains show species in Trophic levels and multiple food chains usually exist within a community, shown by a food web.
- Skill: To compare the pyramids of energy from different ecosystems.
- The respiration rate determines the percentage of ingested energy converted to biomass.
- In closed ecosystems energy but not matter is exchanged with the surroundings.
- Application: Conversion ratio is a useful concept in sustainable food production practises.
-
Climate can be used to predict the type of stable ecosystem that will emerge in an area. - Skill: to be able to analyse a climograph which shows the connection between the type of ecosystem and climatic factors such as rainfall and temperature.
- Disturbance influences the structure and rate of change within ecosystems.
- Skill: Investigation into the effect of an environmental disturbance on an ecosystem, such as: species diversity, nutrient cycling, water movement, erosion, leaf area index, etc..
- Skill: Analysis of data showing primary succession.
Revision Question(s)
- How quickly is energy lost from an ecosystem?
- Where does lost energy go?
- How important is energy efficiency in a closed ecosystem?
- Why might it be better to consume insects for their protein rather than beef?
-
What determines the type of community which becomes established in different parts of the world? -
What happens to the number of species in an ecosystem if it is disturbed? - In an ecosystem, which places store the nutrients?
Skills ( can you ...)
- Construct Gersmehl diagrams to show the inter-relationships between nutrient stores and flows between taiga, desert and tropical rainforest.
- Consider one example of how humans interfere with nutrient cycling.
C.3 Impact of humans on ecosystems
- Alien species are introduced species which escape into a local ecosystem and become invasive.
- When alien species become invasive there can be a reduction in the numbers of endemic species because of competitive exclusion or the absence of predators.
- Application: Study of the introduction of cane toads in Australia and one other local example of the introduction of an alien species.
- Biomagnification is the process where pollutants become concentrated in the tissues of organisms at higher trophic levels.
- Application: Discussion of the trade-off between control of the malarial parasite and DDT pollution.
- Macroplastic and microplastic debris has accumulated in marine environments.
- Application: Case study of the impact of marine plastic debris on Laysan albatrosses and one other named species.
Revision Question(s)
-
Competition between species takes place in most ecosystems. What resources do species compete for?
-
Competitive exclusion takes place where one species can't get enough resources, what does this mean?
- Fish like farmed Salmon can also contain high concentrations of DDT. What could cause this toxicity?
Skills ( can you ...)
- Analyse data illustrating the causes and consequences of biomagnification.
- Evaluate eradication programmes and biological control as measures to reduce the impact of alien species.
C4 Conservation of biodiversity
- The use of indicator species to assess a specific environmental condition.
- The calculation of a Biotic index, using relative numbers of indicator species.
- Active management of nature reserves or national parks is called In situ conservation.
- Outside their habitat, Ex situ conservation preserves species.
- Biogeographic factors affect species diversity.
- Richness and evenness are components of biodiversity.
Revision Question(s)
- Laysan albatross could be called an indicator species of ocean plastic.
- What is the best method of conserving species?
- Why are conservationist escorting to captive breeding and release rather than in-situ conservation?
- What makes a good nature reserve?
- How can biodiversity be measured to take into consideration species richness and evenness?
Skills ( can you ...)
- Demonstrate a knowledge of captive breeding and reintroduction of an endangered animal species.
- Analyse data on the impact of island size and edge effects on biodiversity.
- Using Simpson’s reciprocal index of diversity ( Simpsons diversity index) to compare biodiversity.

D = diversity index, N = total number of organisms of all species found and n = number of individuals of a particular species.
C5 Populations - HL
Understanding(s)
- The size of a population can be estimated using sampling. e.g. the Lincoln index.
- In an unlimited environment exponential growth pattern of a population occurs.
- As a population size reaches the carrying capacity of the environment the rate of growth slows.
- Limiting factors prevent unlimited growth of populations, e.g. Bottom-up control of algal blooms by lack of nutrients and top-down control of algae by herbivory
- Students should understand how rates of natality, mortality, immigration and emigration can be used to explain the phases of sigmoid growth curve and population size.
Revision Question(s)
- If we can't count every member of a population how can we estimate the population size?
- How can we estimate the reliability of methods used to estimate population?
- What are the requirements of successful reproduction, and survival of offspring?
- How would an increase in the death rate or the birth rate affect a population size.
- What might individuals do in times of hardship to increase their survival chances?
- How can we use Capture - mark - release - recapture methods to estimate fish stocks?
- What are the limitations of such methods?
Skills ( can you ...)
- Evaluate methods of estimating fish stocks in the marine environment (Oceans and seas).
- Understand how to use the capture-mark-release-recapture method to estimate the population size of an animal species.
- Interpret data about the sustainability of fishing practices, including the effect of population size, age and reproductive status.
- Model the sigmoid growth curve using a simple organism such as yeast or species or duckweed.
C6 Nutrient cycles - HL
Understanding(s)
- Atmospheric nitrogen is converted to ammonia by Nitrogen-fixing bacteria.
- Rhizobium bacteria have a mutualistic relationship with some plants and fix nitrogen in roots..
- Bacteria will reduce nitrate in the soil back to atmospheric nitrogen in anaerobic conditions, (Denitrification)
- e.g. in waterlogged soil where insectivorous plants are adapted to survive the low nitrate levels.
- The application of fertilizer adds Phosphorus to the phosphorus cycle
- The harvesting of agricultural crops removes phosphorous from the cycle.
- The rate of turnover in the phosphorus cycle is much slower than the nitrogen cycle.
- Availability of phosphate may become limiting to agriculture in the future.
- Leaching of mineral nutrients from agricultural land into rivers causes eutrophication and leads to increased biochemical oxygen demand.
Revision Question(s)
- What are the different molecules which make up the nitrogen cycle?
- How can nitrogen from the air be fixed into organic molecules?
- Why do wetland areas often have low nitrate soils and insectivorous plants?
- How can phosphorous be added and removed from the soil?
- Where does the phosphorous for fertilizer manufacture come from?
- Why is the pḧospĥorus cycle slower that the nitrogen cycle?
Skills ( can you ...)
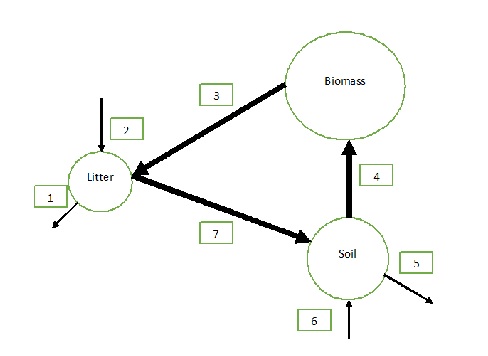
- Draw and label a diagram of the nitrogen cycle.
- Assess the nutrient content of a soil sample.
Exam style question on C1
Community structure is the distribution of organisms within an ecosystem.
Answer the question on a piece of paper, then check your answer against the model answer.
Explain the importance of the following factors in determining community structure.
- Keystone species. (2 marks)
- Limiting factor. (2 marks)
- Competitive exclusion. (2 marks)
Examiner hint: Examples are useful to help with your explanation.
Click the + icon to see a model answer.
Drag and drop activities
Test your ability to construct biological explanations using the drag and drop question below.
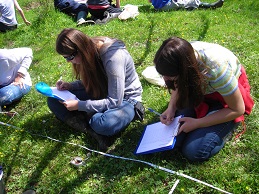
C1 The picture shows students taking a sample along a line transect.
distribution edaphic human gradient random touching repeatable
A transect is used in ecological studies to investigate the of a species in relation to an factor such as soil pH.
In order for the data collected along a transect line, the methodology used must be a sample (not subject to bias), (an accurate record of the methodology and sampling method) and positioned along an environmental .
The species the line are recorded and a graphical representation of the species distribution against the edaphic factor can be obtained.
Examiner hint: Ecologicla methods must have random sampling and be repeatable.
C2 Food webs are an important aspect of this topic.
relationships accurate omnivores season single community herbivores multiple trophic availability
Food webs are a more indication of feeding within a than food chains. This is because many consumers, for example , may feed at different levels in the web and because their feeding habits may change with food , their their age and the of the year. This positions the producers and consumers in food chains in a particular food web.
Animals may change their food sources at different stages in their life.
C3 Biomagnification and bioaccumulation of toxins, pollutants and industrial chemicals are a serious environmental concern.
stable producers concentration excreted ingestion highest successive metabolised higher persistent lower egestion metals carnivores
Biomagnification is the increase in of a toxin at higher levels in a food chain. It occurs when the toxin is (chemically in the environment or the organism), slow to be and not as waste. This causes bioaccumulation in the organisms at one level of the food chain.
Heavy and persistent pesticides enter aquatic ecosystems and are incorporated into and then consumers by achieving biomagnification, increasing concentrations in the levels of food chains. The toxic effects are particularly evident in top as the concentrations are greatest at the level of the food chain.
Biomagnification will occur when a toxic compound is persistent and not excreted.
C4 Richness and evennes are two indicators of biodiversity.
each Simpson’s Darwins community Biodiversity high different lower Evenness
is the variety of living organisms present in a particular area. It has two components:
- Richness – the number of species in the area.
- – the relative abundance of the species in the area.
reciprocal index takes account of both richness and evenness, a value represents a more biodiverse .
It is important to distinguish between richness and evenness.
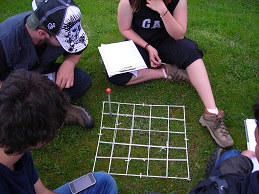
C5 The photograph shows quadrat sampling.
valid numbered repeats mapped random bias malpractice animal heterogenous counted homogeneous big
Quadrat sampling a method that can be used to sample plant or non-moving populations in a relatively area.
The chosen area is then delineated by a grid. A pair of coordinates is generated using numbers on a calculator. This avoids human . The quadrat is paced on the part of the grid as decided by the random numbers and the number of each species present in the quadrat is . Sufficient must be taken to ensure a sample.
Quadrat sampling must be repeatable and random.
C6 Phosphorus is a common limiting factor for plant growth and ecosystem abundance.
fertilisers insoluble dissolve nucleic inorganic membrane organic ATP cell walls improve soluble Recyclers disrupt water consumers
Phosphorus is a major component in organisms of acids, and plasma phospholipids.
Phosphates are found as rocks. As the phosphate containing rocks are eroded and they go into solution in soil or in aquatic systems. Plants take up these phosphates from the soil, converting them to organic phosphates which are ingested by .
return the phosphates to the soil from the decaying bodies of animals and plants.
Humans the phosphorus cycle by the use of and removal of crop plants leaving less organic phosphate for soil recycling.
The phosphate cycle has no gaseous component and is more easily disrupted by humans than the nitrogen cycle. Phosphates in soil are a vital nutrient for plants.








 Twitter
  Facebook
  LinkedIn