Logarithmic Scales
What are logarithmic scales?
- Logarithmic scales are scales where intervals increase exponentially
- A normal scale might go 1, 2, 3, 4, ...
- A logarithmic scale might go 1, 10, 100, 1000, ...
- Sometimes we can keep the scales with constant intervals by changing the variables
- If the values of x increase exponentially: 1, 10, 100, 1000, ...
- Then you can use the variable log x instead which will have the scale: 1, 2, 3, 4, ...
- This will change the shape of the graph
- If the graph transforms to a straight line then it is easier to analyse
- Any base can be used for logarithmic scales
- The most common bases are 10 and e
Why do we use logarithmic scales?
- For variables that have a large range it can be difficult to plot on one graph
- Especially when a lot of the values are clustered in one region
- For example: populations of countries
- This can range from 800 to 1 450 000 000
- If we are interested in the rate of growth of a variable rather than the actual values then a logarithmic scale is useful
log-log & semi-log Graphs
What is a log-log graph?
- A log-log graph is used when both scales of the original graph are logarithmic
- You transform both variables by taking logarithms of the values
- log y & log x will be used instead of y & x
- Power graphs (
) look like straight lines on log-log graphs
What is a semi-log graph?
- A semi-log graph is used when only one scale (the y-axis) of the original graph are logarithmic
- You transform only the y-variable by taking logarithms of those values
- log y will be used instead of y
- Exponential graphs (
) look like straight lines on semi-log graphs
How can I estimate values using log-log and semi-log graphs?
- Identify whether one or both of the scales are logarithmic
- Identify the variable so that the scales have equal intervals
- x : 1, 10, 100, 1000, ... use log x
- For x : 1, e, e², e3, ... use ln x
- If you are asked to estimate a value:
- First find the value of any logarithms
- For example: log y, ln x, etc
- Use the graph to read off the value
- If it is a value for a logarithm find the actual value using:
- First find the value of any logarithms
Exam Tip
- Pay close attention to which base is being used (log or ln)
Worked Example
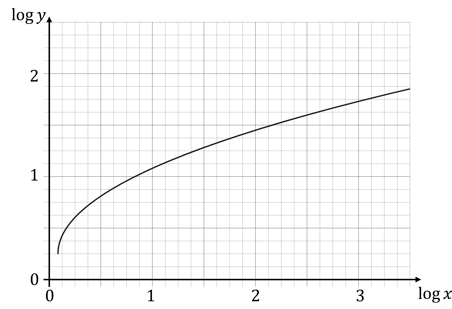
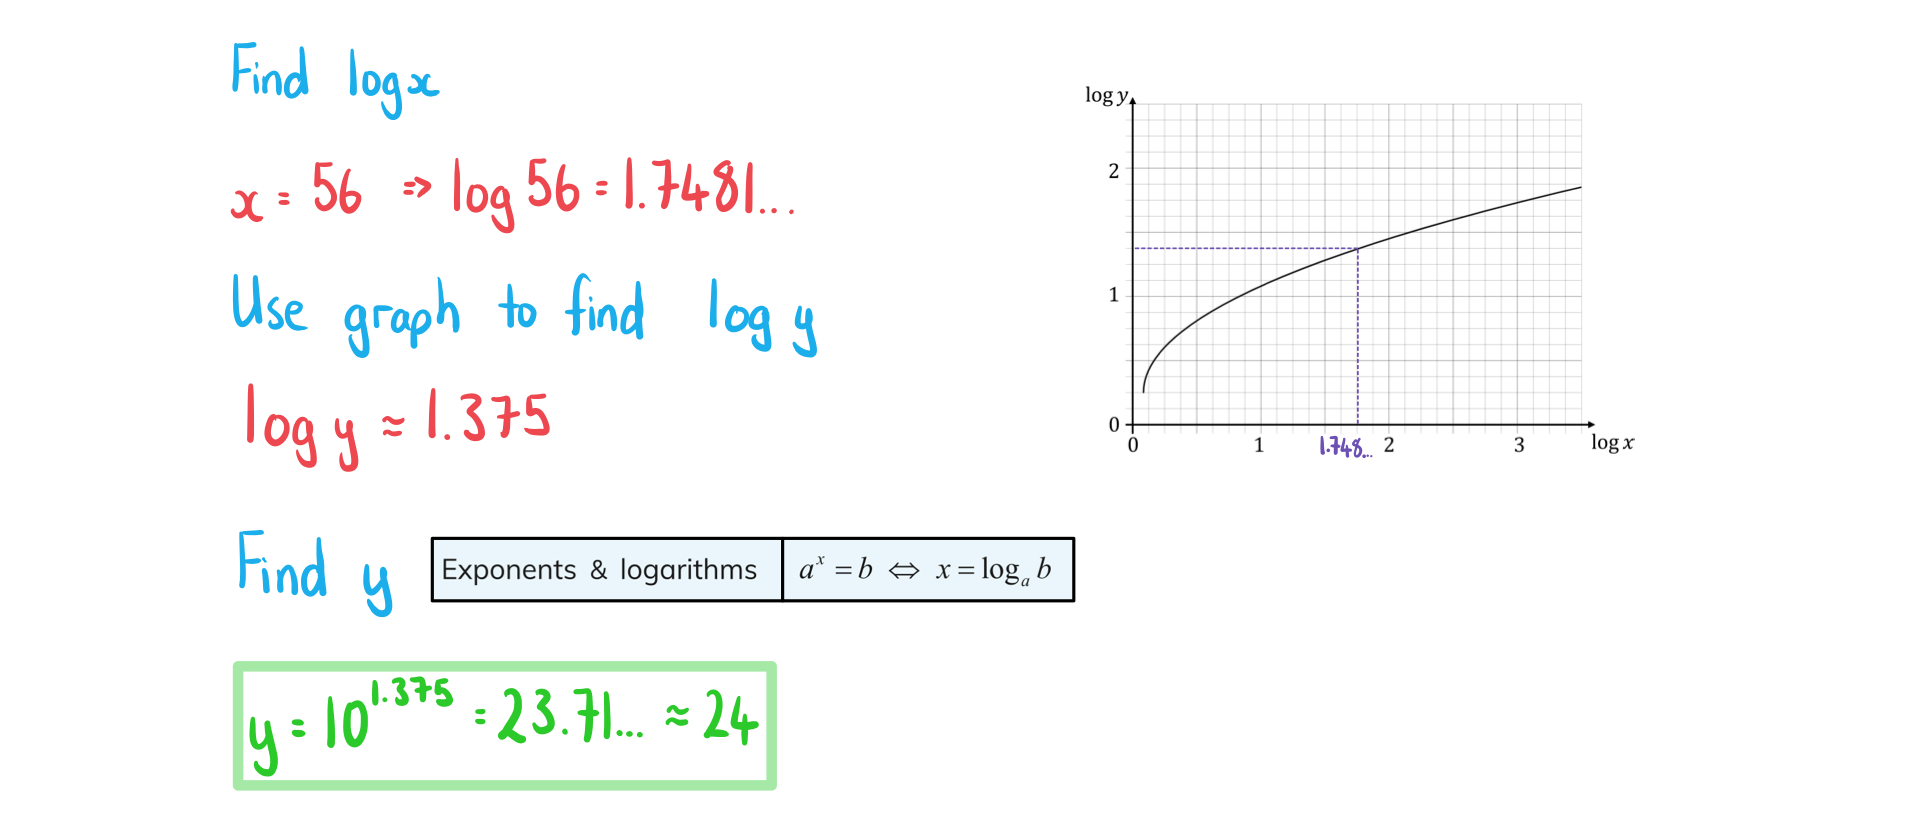
The function is drawn below using a log-log graph.
 Show that when
 the value of
is approximately 24.

