Binomial Hypothesis Testing
What is a hypothesis test using a binomial distribution?
- You can use a binomial distribution to test whether the proportion of a population with a specified characteristic has increased or decreased
- These tests will always be one-tailed
- You will not be expected to perform a two-tailed hypothesis test with the binomial distribution
- A sample will be taken and the test statistic x will be the number of members with the characteristic which will be tested using the distribution
- This can be thought of as the number of successes
What are the steps for a hypothesis test of a binomial proportion?
- STEP 1: Write the hypotheses
- H0 : p = p0
- Clearly state that p represents the population proportion
- p0 is the assumed population proportion
- H1 : p < p0 or H1 : p > p0
- H0 : p = p0
- STEP 2: Calculate the p-value or find the critical region
- See below
- STEP 3: Decide whether there is evidence to reject the null hypothesis
- If the p-value < significance level then reject H0
- If the test statistic is in the critical region then reject H0
- STEP 4: Write your conclusion
- If you reject H0 then there is evidence to suggest that...
- The population proportion has decreased (for H1 : p < p0)
- The population proportion has increased (for H1 : p > p0)
- If you accept H0 then there is insufficient evidence to reject the null hypothesis which suggests that...
- The population proportion has not decreased (for H1 : p < p0)
- The population proportion has not increased (for H1 : p > p0)
How do I calculate the p-value?
- The p-value is determined by the test statistic x
- The p-value is the probability that ‘a value being at least as extreme as the test statistic’ would occur if null hypothesis were true
- For H1 : p < p0 the p-value is
- For H1 : p > p0 the p-value is
How do I find the critical value and critical region?
- The critical value and critical region are determined by the significance level α%
- Your calculator might have an inverse binomial function that works just like the inverse normal function
- You need to use this value to find the critical value
- The value given by the inverse binomial function is normally one away from the actual critical value
- For H1 : p < p0 the critical region is
where c is the critical value
- c is the largest integer such that
- Check that
- For H1 : p > p0 the critical region is
where c is the critical value
- c is the smallest integer such that
- Check that
Worked Example
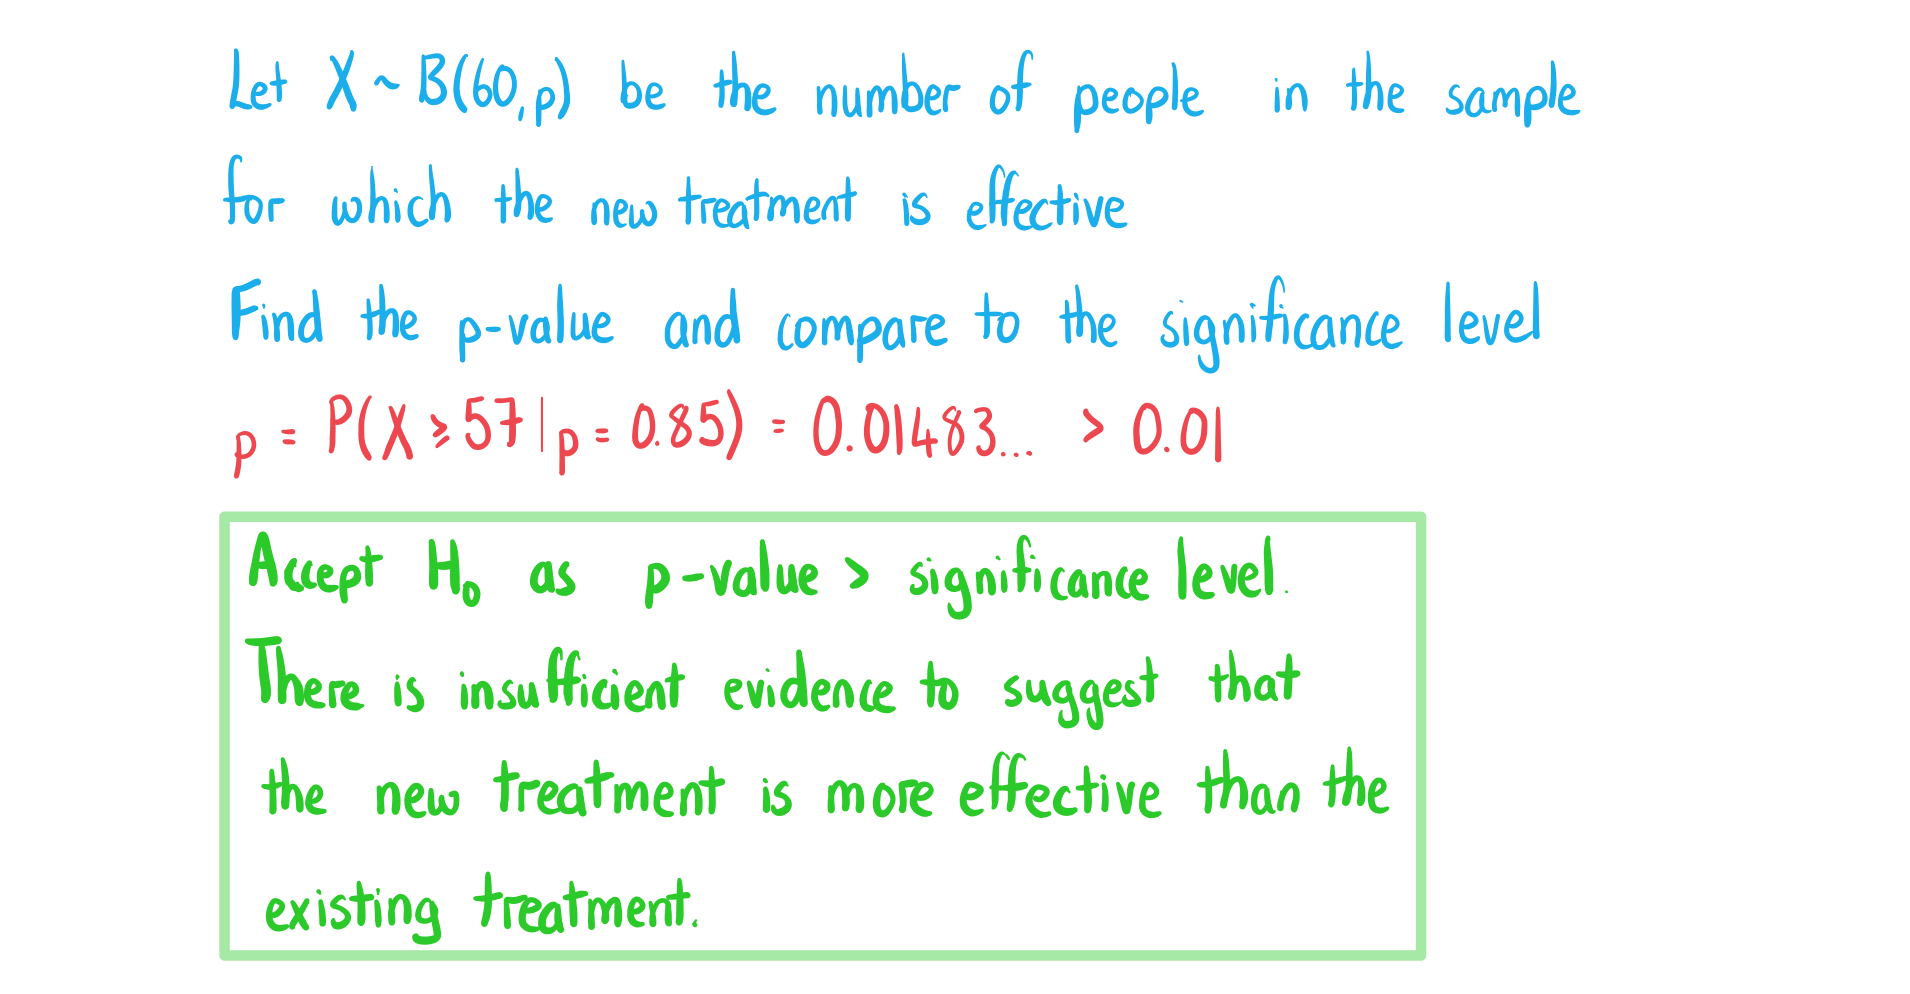
The existing treatment for a disease is known to be effective in 85% of cases. Dr Sabir develops a new treatment which she claims is more effective than the existing one. To test her claim she uses the new treatment on a random sample of 60 patients with the disease and finds that the treatment was effective for 57 of them.
a)
State null and alternative hypotheses to test Dr Sabir’s claim.

b)
Perform the test using a 1% significance level. Clearly state the conclusion in context.

