Transition Matrices
What is a transition matrix?
- A transition matrix T shows the transition probabilities between the current state and the next state
- The columns represent the current states
- The rows represent the next states
- The element of T in the ith row and jth column gives the transition probability tij of :
- the next state being the state corresponding to row i
- given that the current state is the state corresponding to column j
- The probabilities in each column must add up to 1
- The transition matrix depends on how you assign the states to the columns
- Each transition matrix for a Markov chain will contain the same elements
- The rows and columns may be in different orders though
- E.g. Sunny (S) & Cloudy (C) could be in the order S then C or C then S
What is an initial state probability matrix?
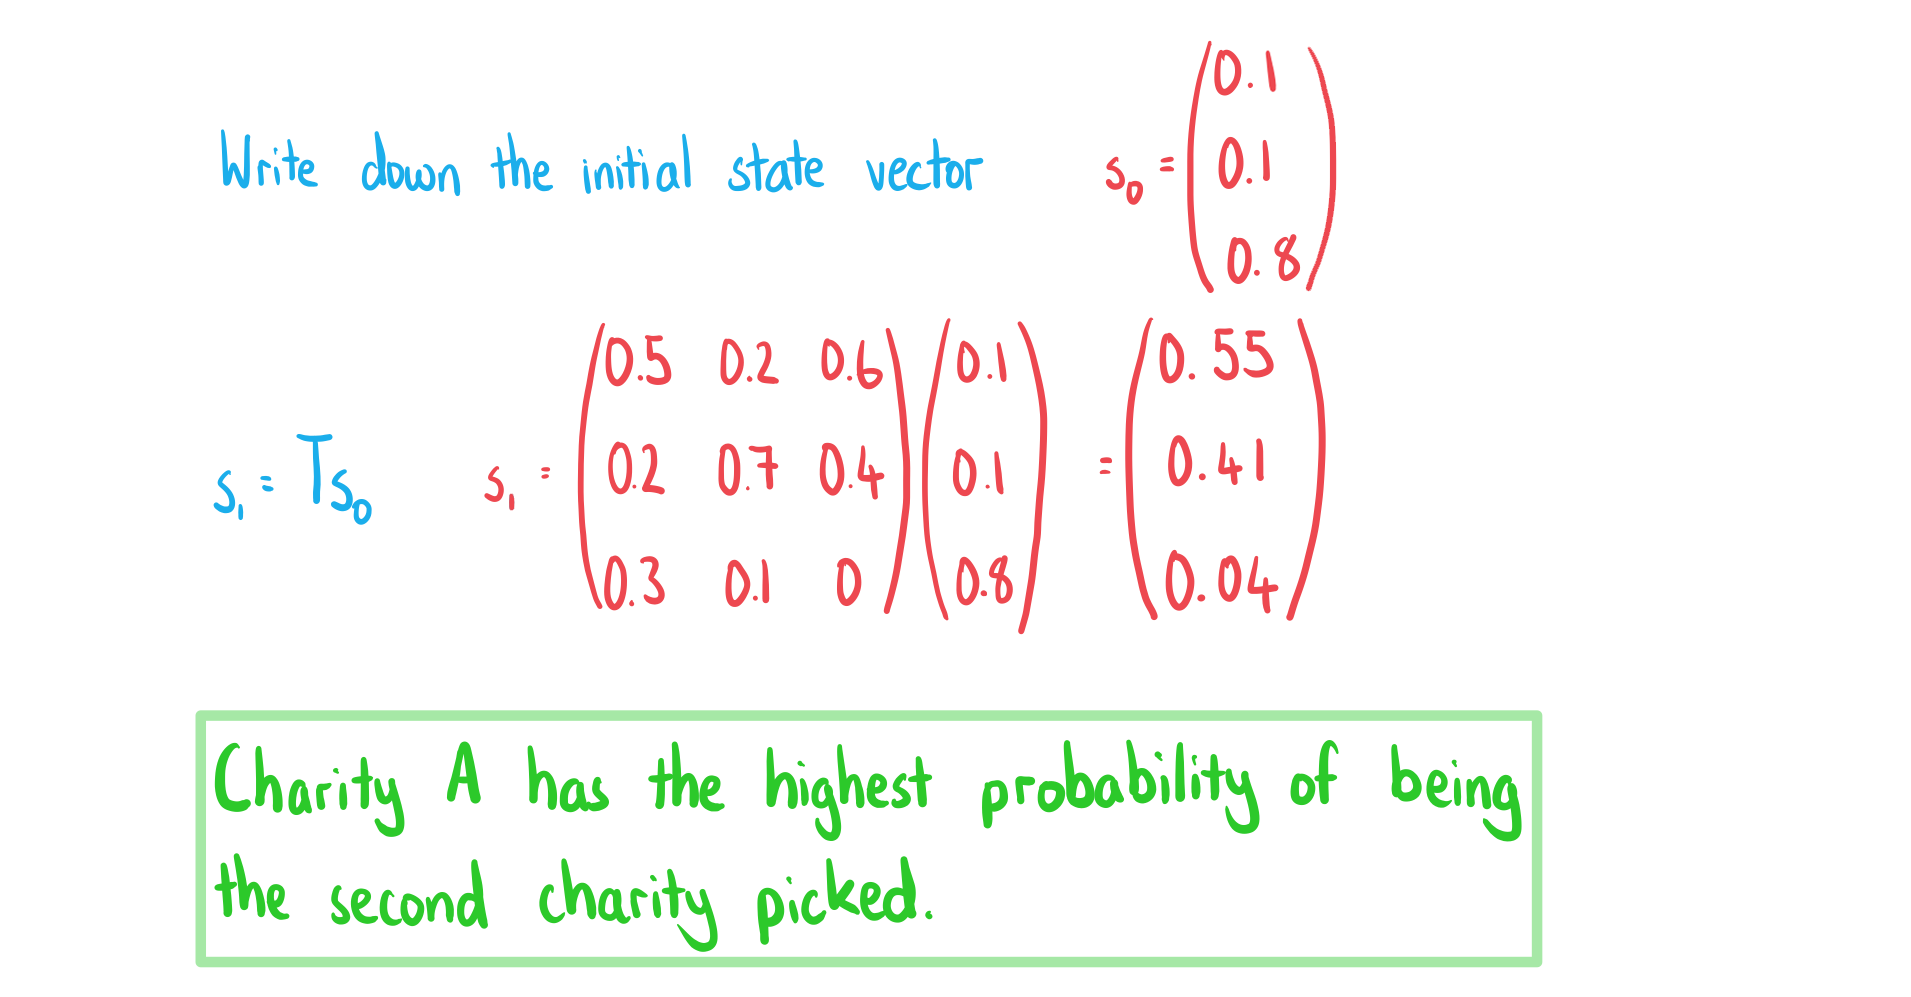
- An initial state probability matrix s0 is a column vector which contains the probabilities of each state being chosen as the initial state
- If you know which state was chosen as the initial state then that entry will be 1 and the others will all be zero
- You can find the state probability matrix s1 which contains the probabilities of each state being chosen after one interval of time
- s1 = Ts0
How do I find expected values after one interval of time?
- Suppose the Markov change represents a population moving between states
- Examples include:
- People in a town switching gyms each year
- Children choosing a type of sandwich for their lunch each day
- Suppose the total population is fixed and equals N
- You can multiply the state probability matrix s1 by N to find the expected number of members of the population at each state
Exam Tip
- If you are asked to find a transition matrix, check that all the probabilities within a column add up to 1
- Drawing a transition state diagram can help you to visualise the problem
Worked Example
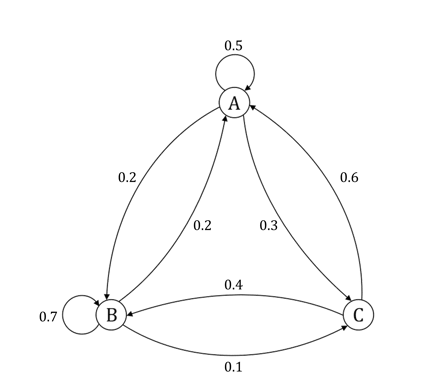
Each year Jamie donates to one of three charities: A, B or C. At the start of each year, the probabilities of Jamie continuing donate to the same charity or changing charities are represented by the following transition state diagram:

Powers of Transition Matrices
How do I find powers of a transition matrix?
- You can simply use your GDC to find given powers of a matrix
- The power could be left in terms of an unknown n
- In this case it would be more helpful to write the transition matrix in diagonalised form (see section 1.8.2 Applications of Matrices) T = PDP-1 where
- D is a diagonal matrix of the eigenvalues
- P is a matrix of corresponding eigenvectors
- Then Tn = PDnP-1
- This is given in the formula booklet
- Every transition matrix always has an eigenvalue equal to 1
What is represented by the powers of a transition matrix?
- The powers of a transition matrix also represent probabilities
- The element of Tn in the ith row and jth column gives the probability tnij of :
- the future state after n intervals of time being the state corresponding to row i
- given that the current state is the state corresponding to column j
- For example: Let T be a transition matrix with the element t2,3 representing the probability that tomorrow is sunny given that it is raining today
- The element t52,3 of the matrix T5 represents the probability that it is sunny in 5 days’ time given that it is raining today
- The probabilities in each column must still add up to 1
How do I find the column state matrices?
- The column state matrix sn is a column vector which contains the probabilities of each state being chosen after n intervals of time given the current state
- sn depends on s0
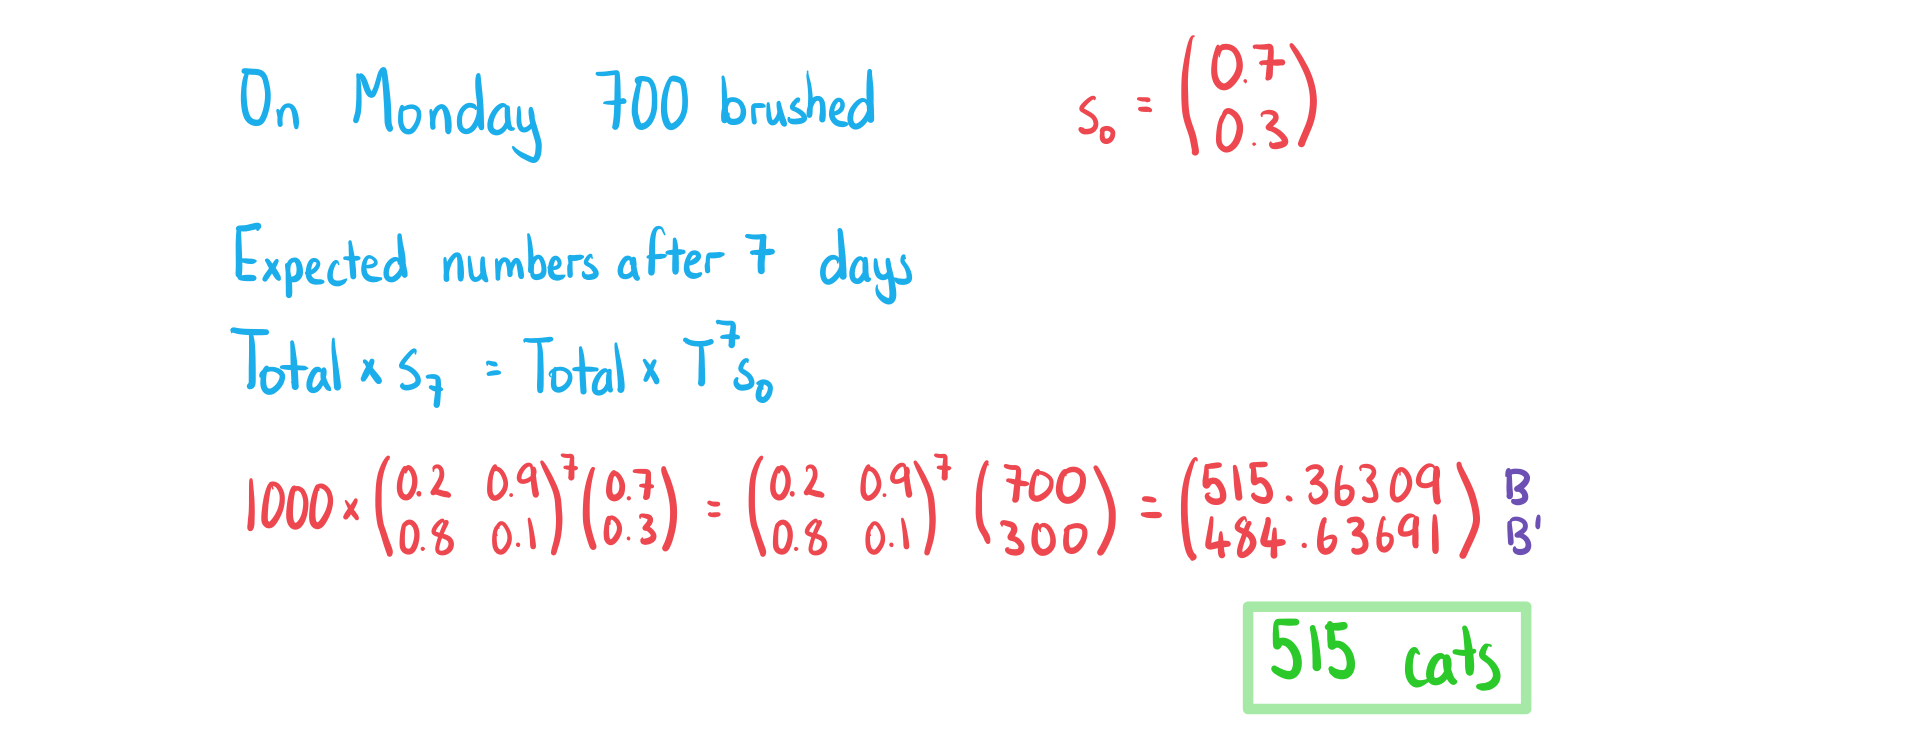
- To calculate the column state matrix you raise the transition matrix to the power n and multiply by the initial state matrix
-
- You are given this in the formula booklet
- You can multiply sn by the fixed population size to find the expected number of members of the population at each state after n intervals of time
Worked Example
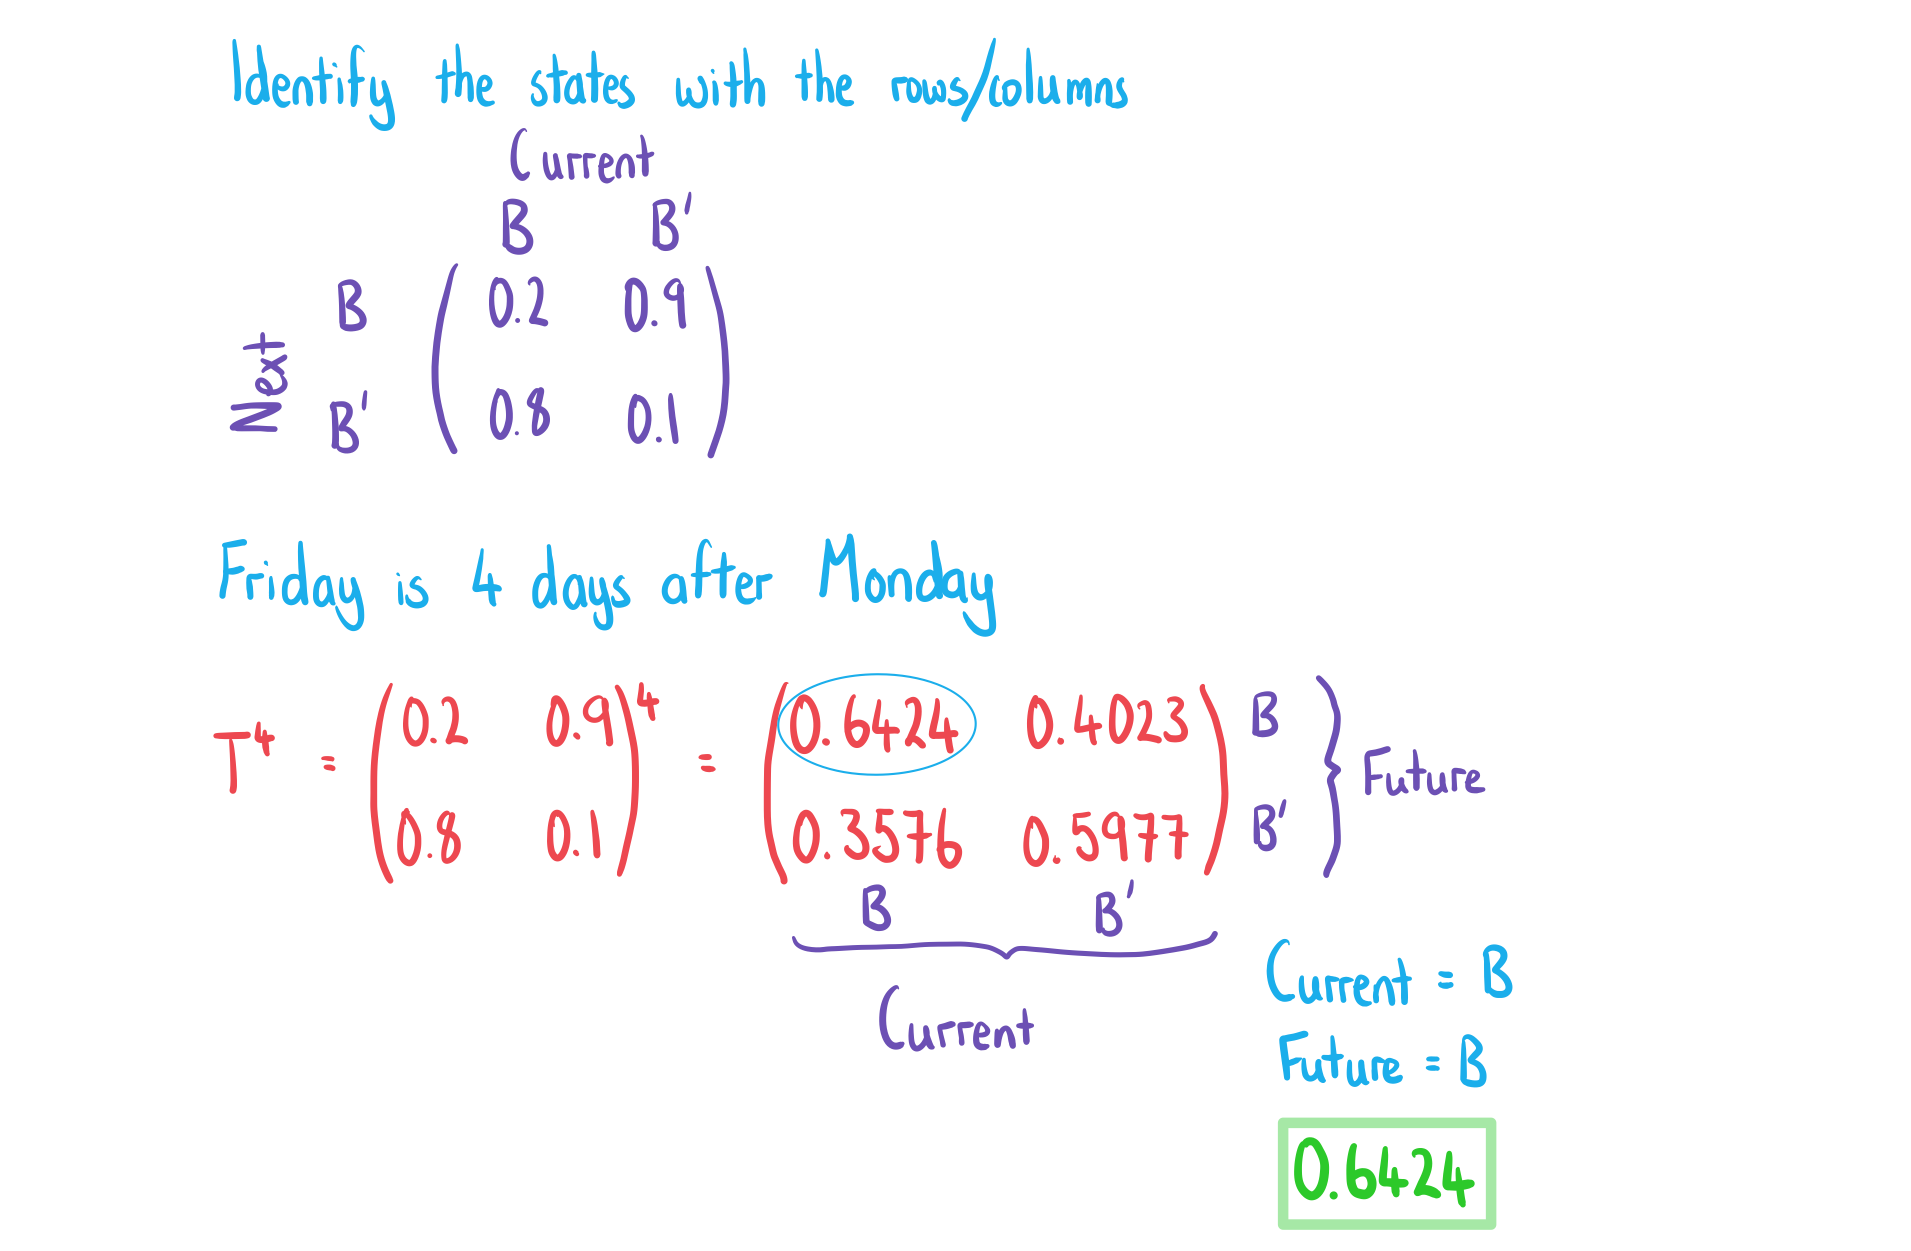
At a cat sanctuary there are 1000 cats. If a cat is brushed on a given day, then the probability it is brushed the following day is 0.2. If a cat is not brushed on a given day, then the probability that is will be brushed the following day is 0.9.
The transition matrix is used to model this information with
.
Steady State & Long-term Probabilities
What is the steady state of a regular Markov chain?
- The vector s is said to be a steady state vector if it does not change when multiplied by the transition matrix
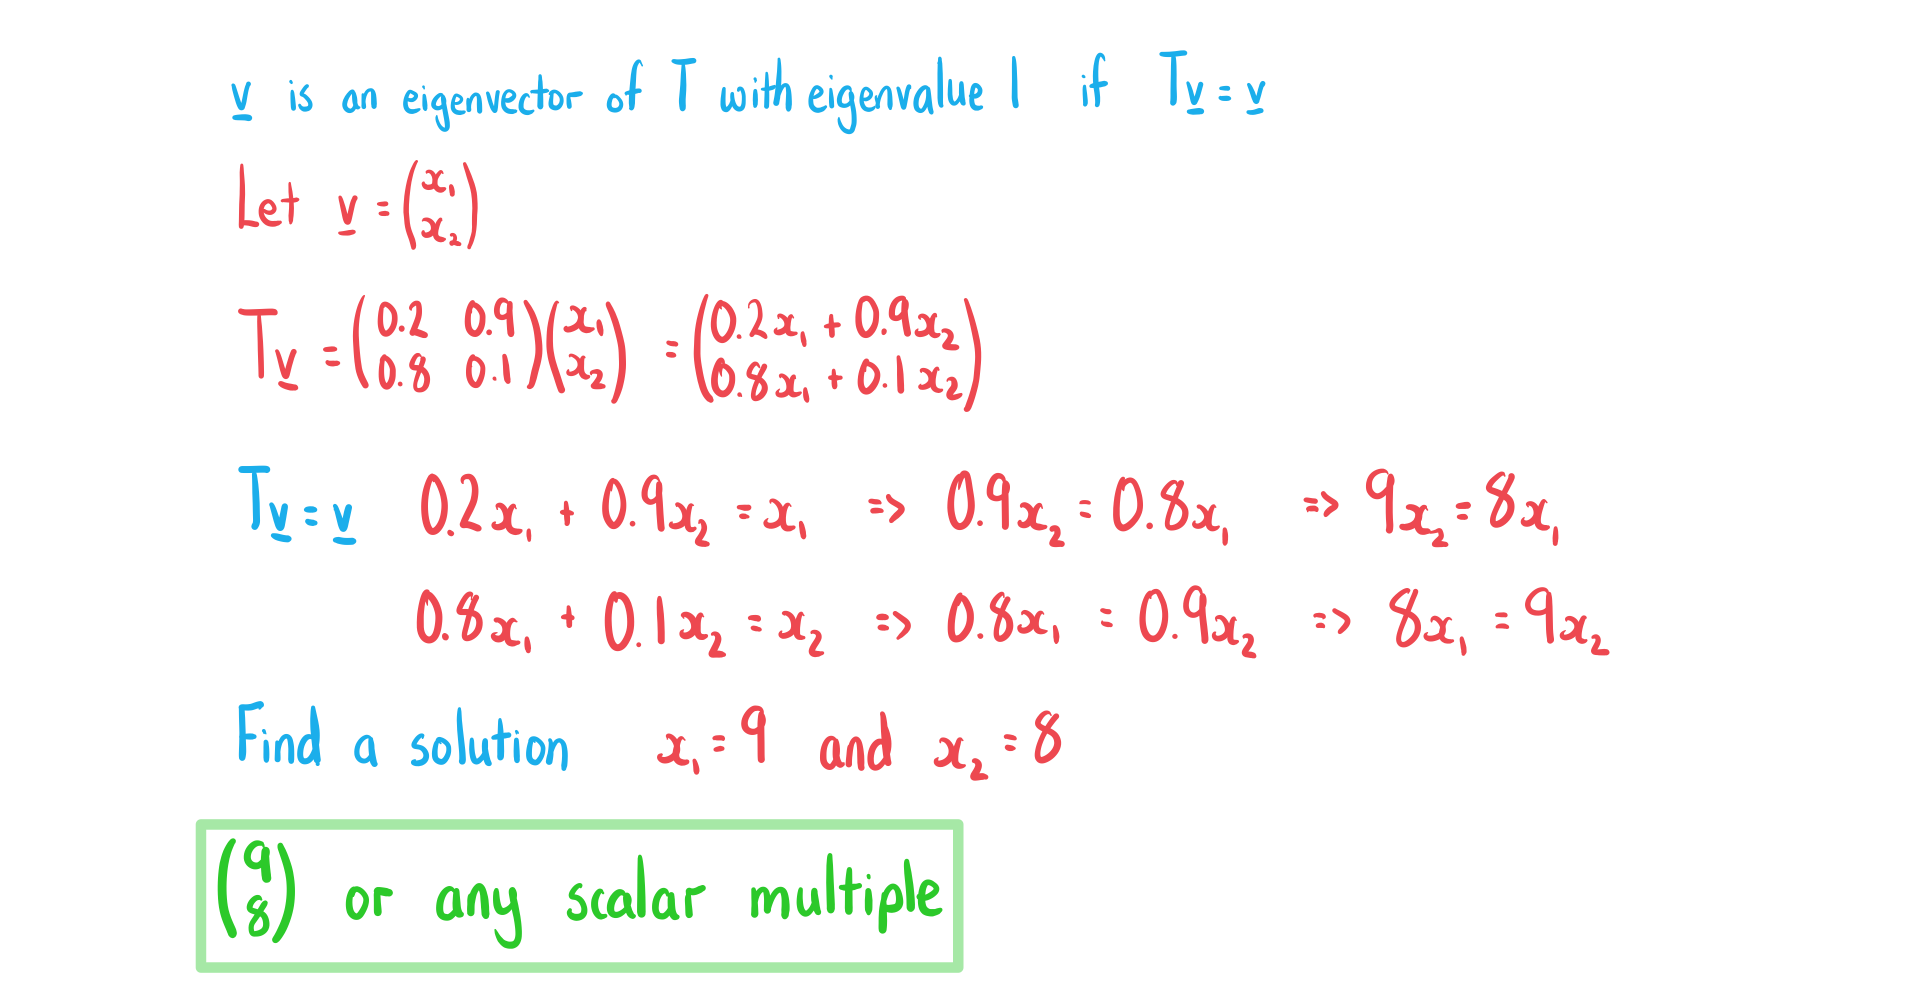
- Ts = s
- Regular Markov chains have steady states
- A Markov chain is said to be regular if there exists a positive integer k such that none of the entries are equal to 0 in the matrix Tk
- For this course all Markov chains will be regular
- The transition matrix for a regular Markov chain will have exactly one eigenvalue equal to 1 and the rest will all be less than 1
- As n gets bigger Tn tends to a matrix where each column is identical
- The column matrix formed by using one of these columns is called the steady state column matrix s
- This means that the long-term probabilities tend to fixed probabilities
- sn tends to s
How do I use long-term probabilities to find the steady state?
- As Tn tends to a matrix whose columns equal the steady state vector
- Calculate Tn for a large value of n using your GDC
- If the columns are identical when rounded to a required degree of accuracy then the column is the steady state vector
- If the columns are not identical then choose a higher power and repeat
How do I find the exact steady state probabilities?
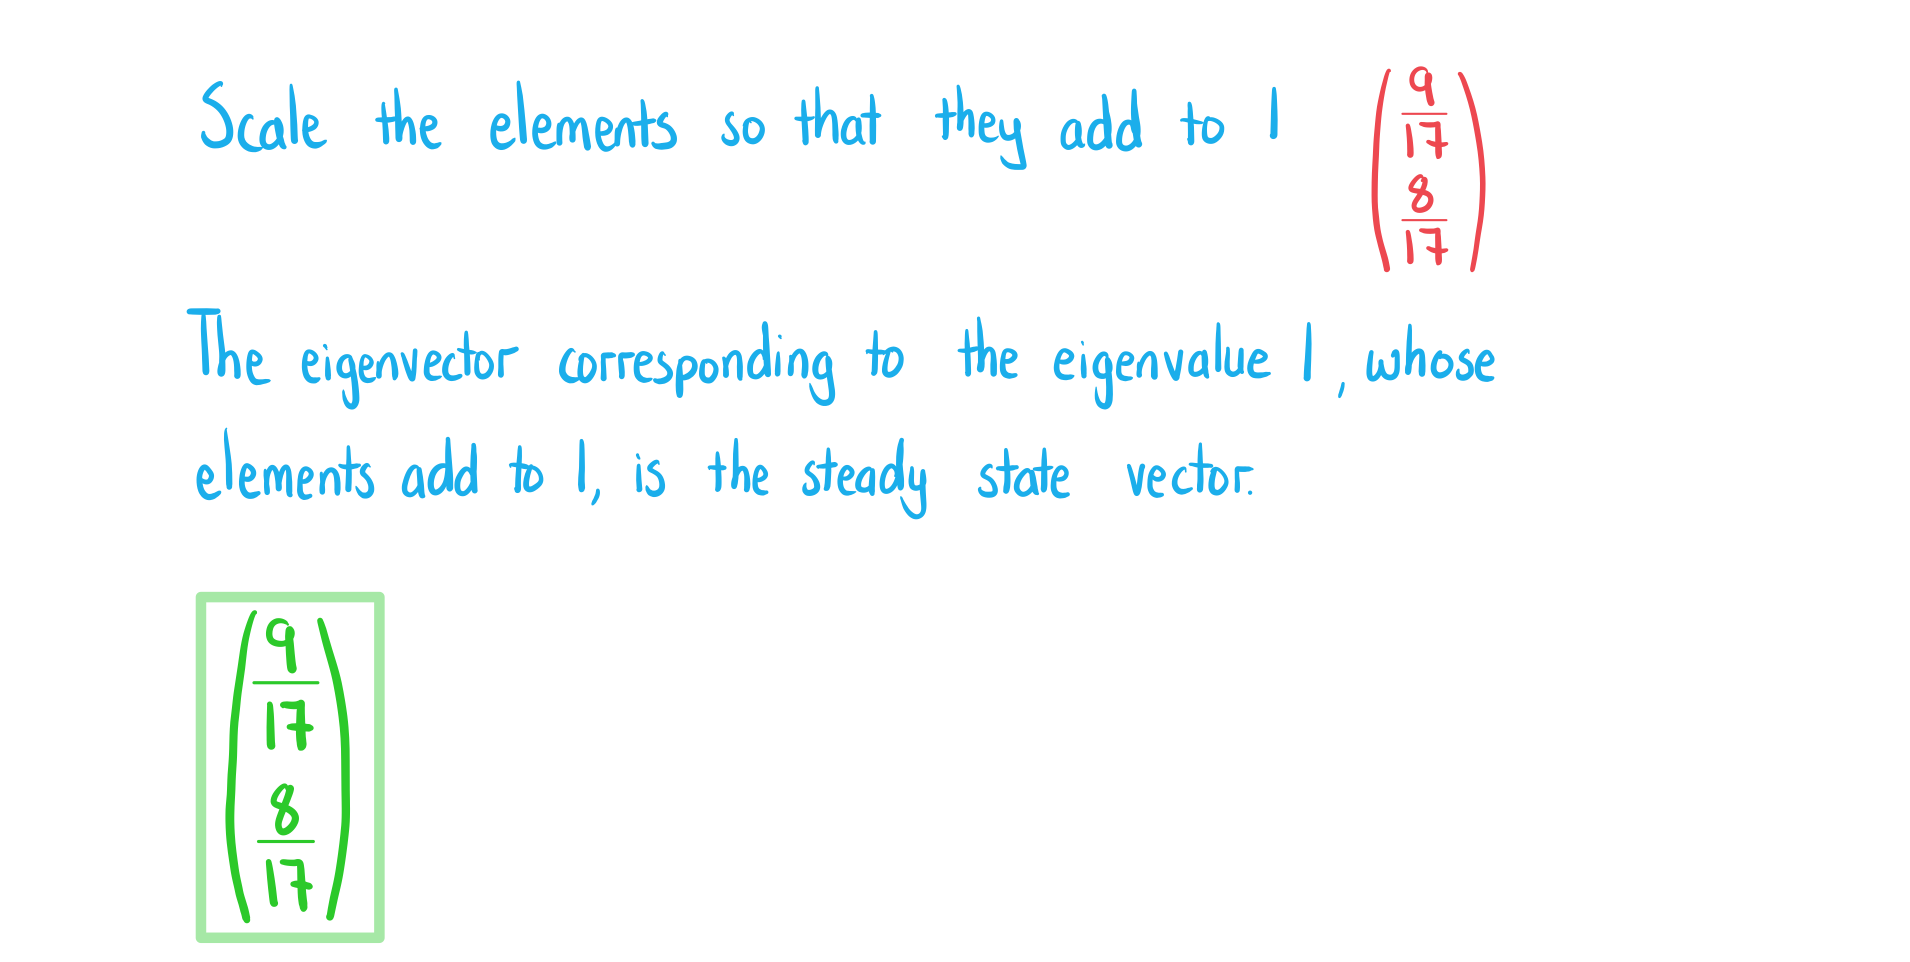
- As Ts = s the steady state vector s is the eigenvector of T corresponding to the eigenvalue equal to 1 whose elements sum to 1:
- Let s have entries x1, x2, ..., xn
- Use Ts = s to form a system of linear equations
- There will be an infinite number of solutions so choose a value for one of the unknowns
- For example: let xn = 1
- Ignoring the last equation solve the system of linear equations to find x1, x2, ..., xn – 1
- Divide each value xi by the sum of the values
- This makes the values add up to 1
- You might be asked to show this result using diagonalisation
- Write T = PDP-1 where D is the diagonal matrix of eigenvalues and P is the matrix of eigenvectors
- Use Tn = PDnP-1
- As n gets large Dn tends to a matrix where all entries are 0 apart from one entry of 1 due to the eigenvalue of 1
- Calculate the limit of Tn which will have identical columns
- You can calculate this by multiplying the three matrices (P, D∞, P-1) together
Exam Tip
- If you calculate
by hand then a quick check is to see if the columns are identical
- It should look like
- It should look like
Worked Example
If a cat is brushed on a given day, then the probability it is brushed the following day is 0.2. If a cat is not brushed on a given day, then the probability that is will be brushed the following day is 0.9.
The transition matrix is used to model this information with
.
