In a new experiment ,the length of the pendulum L is measured with an accuracy of 1.8% and the acceleration due to free-fall g is measured with an accuracy of 1.6%.
(b)
If the time for the pendulum to complete 20 oscillations is 18.4 s, determine the time period for one oscillation and the absolute uncertainty in this value.
The period T for a mass m hanging on a spring performing simple harmonic motion is given by the equation:
T = 2π
Such a system is used to determine the spring constant k. The fractional error in the measurement of the period T is α and the fractional error in the measurement of the mass m is β.
(d)
Determine the fractional error in the calculated value of k in terms of α and β.
An object falls off a cliff of height, h, above the ground. It takes 13.8 seconds to hit the ground.
It is estimated that there is a percentage uncertainty of ± 5% in measuring this time interval. A guidebook of the local area states the height of the cliff is 940 ± 10 m.
(a)
Calculate the acceleration of free-fall of the object and its fractional uncertainty.
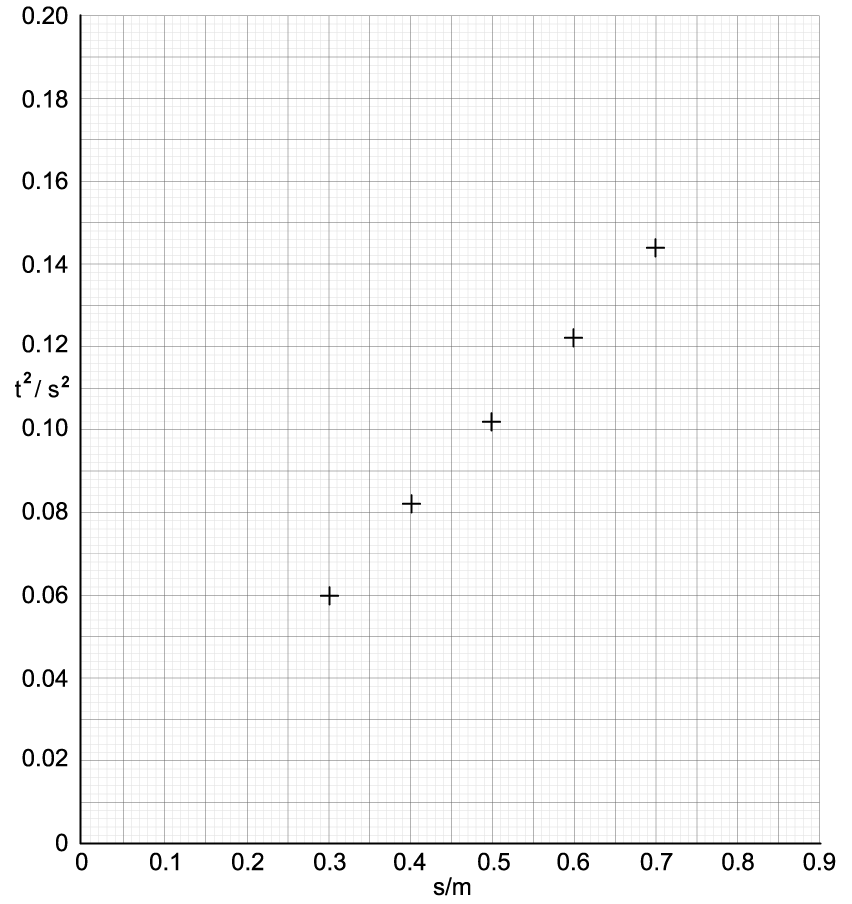
A student performs an experiment to find the acceleration due to gravity. A spherical object falling freely through measured vertical distances s for a time t. The experiment is repeated in a lab and the time is measured electronically.
s / m
t1 / s
t2 / s
t3 / s
mean time t / s
t2 / s2
0.100
0.141
0.138
0.144
0.141
0.020
0.200
0.201
0.205
0.209
0.205
0.042
0.300
0.240
0.246
0.250
0.245
0.0600
0.400
0.285
0.288
0.284
0.286
0.0818
0.500
0.315
0.319
0.323
0.319
0.102
0.600
0.345
0.349
0.354
0.349
0.122
0.700
0.376
0.379
0.382
0.379
0.144
0.800
0.399
0.405
0.407
0.404
0.163
0.900
0.426
0.428
0.432
0.429
0.184
(c)
Plot the data on the graph below, including error bars and a line of best fit.
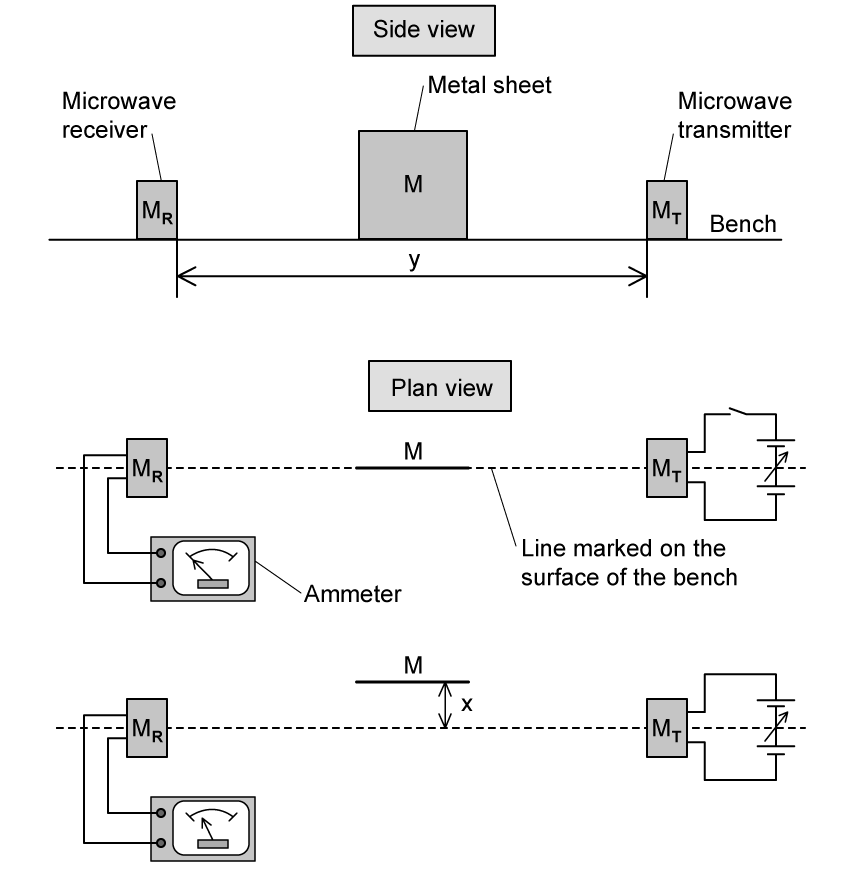
At the first minimum position, a student labels the minimum n = 1 and records the value of x. The next minimum position is labelled n = 2 and the new value of x is recorded. Several positions of maxima and minima are produced.
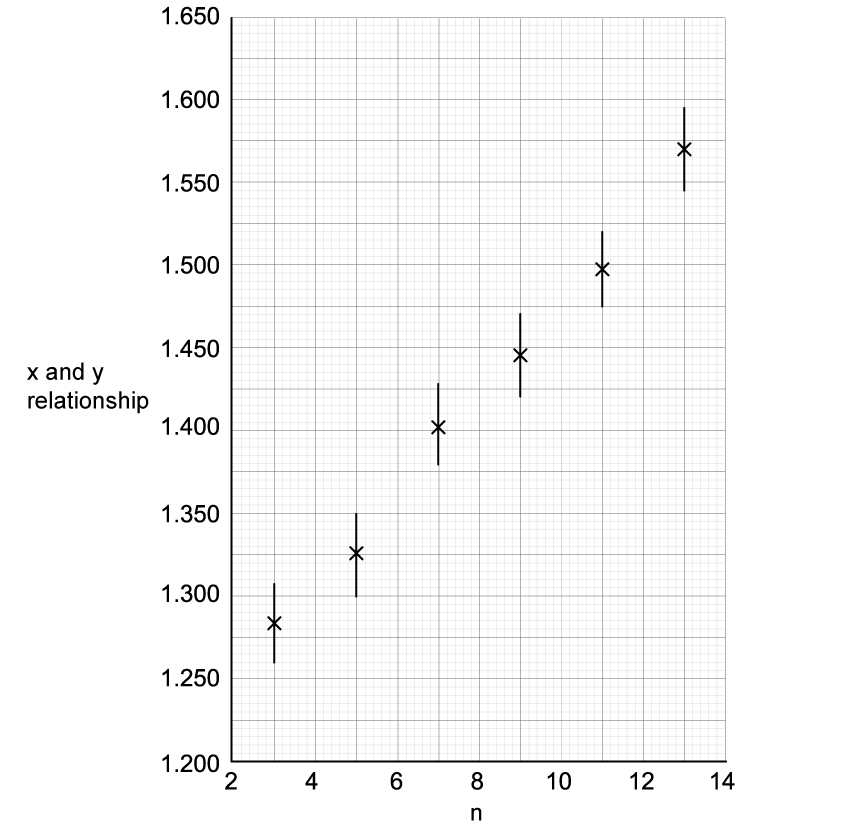
A relationship between x and y against n is shown on the graph. The wavelength λ is the gradient of the graph.
(b)
Determine the maximum and minimum possible values of λ.
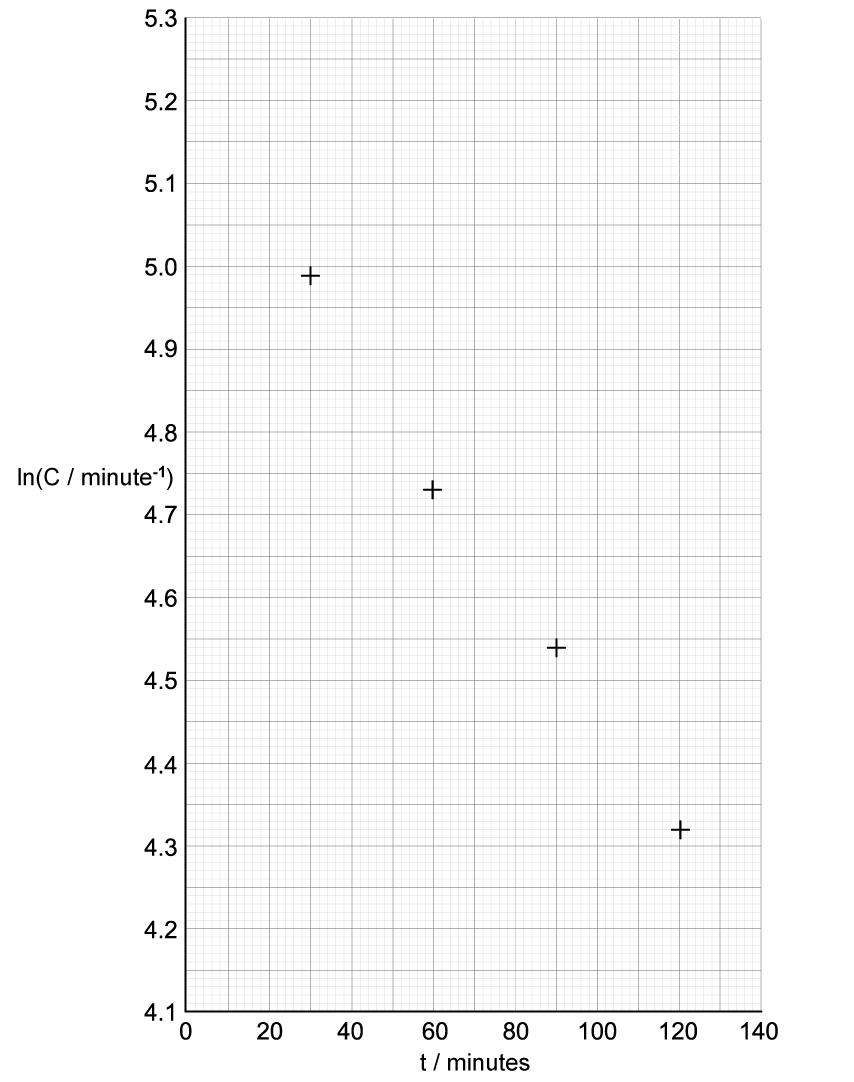
The decay of a radioactive substance can be represented by the equation:
where C is the count rate of the sample at time t, C0 is the initial count rate at time t = 0 and λ is the decay constant.
The half-life, t½ of the radioactive substance is given by
=
An experiment was performed to determine the half-life of a radioactive substance which was a beta emitter. The radioactive source was placed close to a detector.
The results in the table show the total count for exactly 5 minutes, repeated at 15 minute intervals.
time, t / minutes
total count, recorded in 5 minutes
Count rate, C / counts minute–1
ln (C / minute–1)
0
1016
183
5.21
15
920
164
5.10
30
835
147
4.99
45
758
132
4.88
60
665
113
4.73
75
623
105
4.65
90
568
94
4.54
105
520
84
4.43
120
476
75
4.32
135
437
67
4.21
The uncertainty in the count rate, C, is given by
ΔC = ±
(a) Calculate the uncertainty in each value of ln C.
Another student performed the same experiment with identical equipment but took total counts over a 1-minute period rather than a 5-minute period. The total count, C, at 140 minutes was equal to 54 counts.
(d)
Use the relationship
ln(x) = y so x = ey
to estimate the percentage uncertainty in this total count and explain the advantage of using a larger time.


%22%2F%3E%3Cpolyline%20fill%3D%22none%22%20points%3D%226%2C0%202%2C-18%201%2C-16%22%20stroke%3D%22%23000000%22%20stroke-linecap%3D%22square%22%20stroke-width%3D%221%22%20transform%3D%22translate(0.5%2C48.5)%22%2F%3E%3Cline%20stroke%3D%22%23000000%22%20stroke-linecap%3D%22square%22%20stroke-width%3D%221%22%20x1%3D%2214.5%22%20x2%3D%2237.5%22%20y1%3D%223.5%22%20y2%3D%223.5%22%2F%3E%3Cline%20stroke%3D%22%23000000%22%20stroke-linecap%3D%22square%22%20stroke-width%3D%221%22%20x1%3D%2218.5%22%20x2%3D%2233.5%22%20y1%3D%2227.5%22%20y2%3D%2227.5%22%2F%3E%3Ctext%20font-family%3D%22Times%20New%20Roman%22%20font-size%3D%2218%22%20font-style%3D%22italic%22%20text-anchor%3D%22middle%22%20x%3D%2225.5%22%20y%3D%2220%22%3EL%3C%2Ftext%3E%3Ctext%20font-family%3D%22Times%20New%20Roman%22%20font-size%3D%2218%22%20font-style%3D%22italic%22%20text-anchor%3D%22middle%22%20x%3D%2225.5%22%20y%3D%2245%22%3Eg%3C%2Ftext%3E%3C%2Fsvg%3E)

%22%2F%3E%3Cpolyline%20fill%3D%22none%22%20points%3D%226%2C0%202%2C-18%201%2C-16%22%20stroke%3D%22%23000000%22%20stroke-linecap%3D%22square%22%20stroke-width%3D%221%22%20transform%3D%22translate(0.5%2C48.5)%22%2F%3E%3Cline%20stroke%3D%22%23000000%22%20stroke-linecap%3D%22square%22%20stroke-width%3D%221%22%20x1%3D%2214.5%22%20x2%3D%2240.5%22%20y1%3D%223.5%22%20y2%3D%223.5%22%2F%3E%3Cline%20stroke%3D%22%23000000%22%20stroke-linecap%3D%22square%22%20stroke-width%3D%221%22%20x1%3D%2218.5%22%20x2%3D%2236.5%22%20y1%3D%2227.5%22%20y2%3D%2227.5%22%2F%3E%3Ctext%20font-family%3D%22Times%20New%20Roman%22%20font-size%3D%2218%22%20font-style%3D%22italic%22%20text-anchor%3D%22middle%22%20x%3D%2227.5%22%20y%3D%2220%22%3Em%3C%2Ftext%3E%3Ctext%20font-family%3D%22Times%20New%20Roman%22%20font-size%3D%2218%22%20font-style%3D%22italic%22%20text-anchor%3D%22middle%22%20x%3D%2227.5%22%20y%3D%2245%22%3Ek%3C%2Ftext%3E%3C%2Fsvg%3E)
format('truetype')%3Bfont-weight%3Anormal%3Bfont-style%3Anormal%3B%7D%3C%2Fstyle%3E%3C%2Fdefs%3E%3Ctext%20font-family%3D%22Times%20New%20Roman%22%20font-size%3D%2218%22%20font-style%3D%22italic%22%20text-anchor%3D%22middle%22%20x%3D%226.5%22%20y%3D%2217%22%3EC%3C%2Ftext%3E%3Ctext%20font-family%3D%22math143f4d31b04031e49f5eb18baba%22%20font-size%3D%2216%22%20text-anchor%3D%22middle%22%20x%3D%2221.5%22%20y%3D%2217%22%3E%3D%3C%2Ftext%3E%3Ctext%20font-family%3D%22Times%20New%20Roman%22%20font-size%3D%2218%22%20font-style%3D%22italic%22%20text-anchor%3D%22middle%22%20x%3D%2236.5%22%20y%3D%2217%22%3EC%3C%2Ftext%3E%3Ctext%20font-family%3D%22Times%20New%20Roman%22%20font-size%3D%2213%22%20text-anchor%3D%22middle%22%20x%3D%2246.5%22%20y%3D%2225%22%3E0%3C%2Ftext%3E%3Ctext%20font-family%3D%22Times%20New%20Roman%22%20font-size%3D%2218%22%20font-style%3D%22italic%22%20text-anchor%3D%22middle%22%20x%3D%2254.5%22%20y%3D%2217%22%3Ee%3C%2Ftext%3E%3Ctext%20font-family%3D%22math143f4d31b04031e49f5eb18baba%22%20font-size%3D%2212%22%20text-anchor%3D%22middle%22%20x%3D%2264.5%22%20y%3D%2212%22%3E%26%23x2212%3B%3C%2Ftext%3E%3Ctext%20font-family%3D%22Times%20New%20Roman%22%20font-size%3D%2213%22%20font-style%3D%22italic%22%20text-anchor%3D%22middle%22%20x%3D%2272.5%22%20y%3D%2212%22%3E%26%23x3BB%3B%3C%2Ftext%3E%3Ctext%20font-family%3D%22Times%20New%20Roman%22%20font-size%3D%2213%22%20font-style%3D%22italic%22%20text-anchor%3D%22middle%22%20x%3D%2277.5%22%20y%3D%2212%22%3Et%3C%2Ftext%3E%3C%2Fsvg%3E)
format('truetype')%3Bfont-weight%3Anormal%3Bfont-style%3Anormal%3B%7D%3C%2Fstyle%3E%3C%2Fdefs%3E%3Ctext%20font-family%3D%22Times%20New%20Roman%22%20font-size%3D%2218%22%20font-style%3D%22italic%22%20text-anchor%3D%22middle%22%20x%3D%222.5%22%20y%3D%2216%22%3Et%3C%2Ftext%3E%3Ctext%20font-family%3D%22Times%20New%20Roman%22%20font-size%3D%2213%22%20text-anchor%3D%22middle%22%20x%3D%229.5%22%20y%3D%2224%22%3E1%3C%2Ftext%3E%3Ctext%20font-family%3D%22math167c6a1e7ce56d3d6fa748ab6d9%22%20font-size%3D%2212%22%20text-anchor%3D%22middle%22%20x%3D%2217.5%22%20y%3D%2224%22%3E%2F%3C%2Ftext%3E%3Ctext%20font-family%3D%22Times%20New%20Roman%22%20font-size%3D%2213%22%20text-anchor%3D%22middle%22%20x%3D%2224.5%22%20y%3D%2224%22%3E2%3C%2Ftext%3E%3C%2Fsvg%3E)

%22%2F%3E%3Cpolyline%20fill%3D%22none%22%20points%3D%226%2C0%202%2C-7%201%2C-6%22%20stroke%3D%22%23000000%22%20stroke-linecap%3D%22square%22%20stroke-width%3D%221%22%20transform%3D%22translate(0.5%2C23.5)%22%2F%3E%3Cline%20stroke%3D%22%23000000%22%20stroke-linecap%3D%22square%22%20stroke-width%3D%221%22%20x1%3D%2214.5%22%20x2%3D%2230.5%22%20y1%3D%224.5%22%20y2%3D%224.5%22%2F%3E%3Ctext%20font-family%3D%22Times%20New%20Roman%22%20font-size%3D%2218%22%20font-style%3D%22italic%22%20text-anchor%3D%22middle%22%20x%3D%2222.5%22%20y%3D%2220%22%3EC%3C%2Ftext%3E%3C%2Fsvg%3E)