Goal
|
Progress
|
Chart
|
|
|
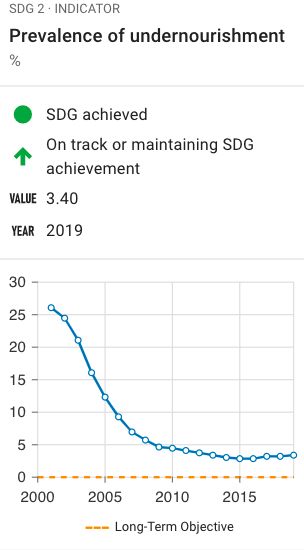
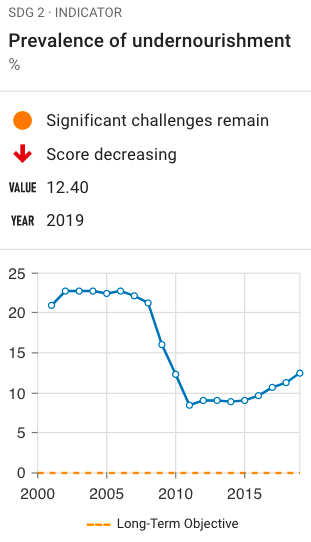
- The prevalence of undernourishment considers the percentage of the population whose food intake is "insufficient to meet dietary energy requirements for a minimum of one year" (SDGIndex)
- "Dietary energy requirements are defined as the amount of dietary energy required by an individual to maintain body functions, health and normal activity" (SDGIndex)
- Between 2008 and 2011 there was good progress with the value falling from 22 to 8
- Undernourishment has been increasing slowly, but steadily since then and in 2020 was at 13
- Undernourishment causes productivity to fall and it can be assumed that with increasing undernourishment, health and productivity will worsen
|
|
|

|
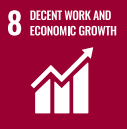
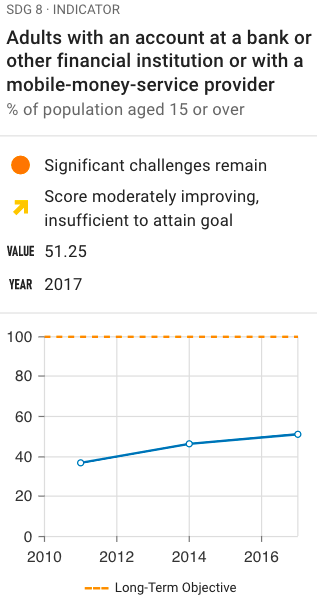
- This metric considers "the percentage of adults, 15 years and older, who report having an account (by themselves or with someone else) at a bank or another type of financial institution, or who have personally used a mobile money service within the past 12 months" (SDGIndex)
- Access to banking increases the ability to make transactions that can improve the standard of living e.g. remote vendors selling agricultural products can receive payment by mobile phone
- Progress is slow. Between 2011 and 2018 there has been a small improvement in access to banking moving from 38% of the population to 50%
- In the final 4 years the increasing trend was starting to flatten
- This value is still well below the target but the data is not current. However, judging by the trend, the current percentage is not likely to be much higher
|
|
|

|
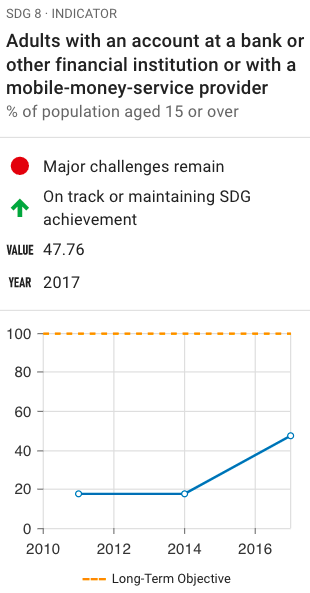
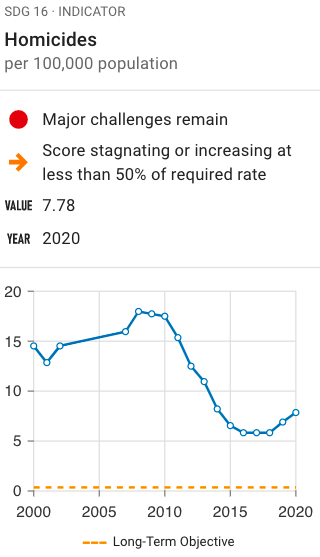
- The number of intentional homicides per 100,000 people
- "Intentional homicides are estimates of unlawful homicides purposely inflicted as a result of domestic disputes and interpersonal violence and do not include all killing, such as killing in armed conflict" (SDGIndex)
- The progress in Ecuador between 2000 and 2020 has been mostly positive
- It initially increased between 2001 and 2007 when it peaked at a value of 18
- Homicides then fell steadily until 2018 with the lowest recorded value of 6
- Since 2018 there has been a concerning upward trend in this value
- Overall, there is a positive downward trend from a value of 15 in 2000 to a value of 8 in 2020
|
|