An Introduction to AD
- Aggregate demand (AD) is the total demand for all goods/services in an economy at any given average price level
- Its value is often calculated using the expenditure approach
- AD = Consumption (C) + Investment (I) + Government spending (G) + (Exports-Imports) (X-M)
- AD = C + I + G + (X-M)
- If AD increases then economic growth has occurred and vice versa
- Consumption is the total spending on goods/services by consumers (households) in an economy
- Investment is the total spending on capital goods by firms
- Government spending is the total spending by the government in the economy:
- Includes public sector salaries, payments for the provision of merit and public goods etc.
- It does not include transfer payments
- Net exports are the difference between the revenue gained from selling goods/services abroad and the expenditure on goods/services from abroad
- Individuals, firms and governments export/import
- Individuals, firms and governments export/import
The relative importance of the components of AD
- Depending on the country, the value of each component and its contribution to AD can vary significantly:
- Government spending in Sweden is 53% of AD and in the UK, it is 25% of AD
- Government spending in Sweden is 53% of AD and in the UK, it is 25% of AD
- The % that each component contributes to AD in the UK is approximately
- Consumption: 60%
- Investment: 14%
- Government spending: 25%
- Net Exports: 1%
- A 1 % increase in consumption or government spending will have a much larger impact on economic growth than a 1% increase in net exports
The AD Curve
- The relationship between the average price level and the total output in an economy is shown with an aggregate demand (AD) curve

The aggregate demand (AD) curve for an economy with Average Price Level on the Y axis and Real GDP on the X axis
- The AD curve is downward sloping
- With lower average price levels there is greater aggregate demand
- With higher average price levels there is less aggregate demand
A Movement Along the AD Curve
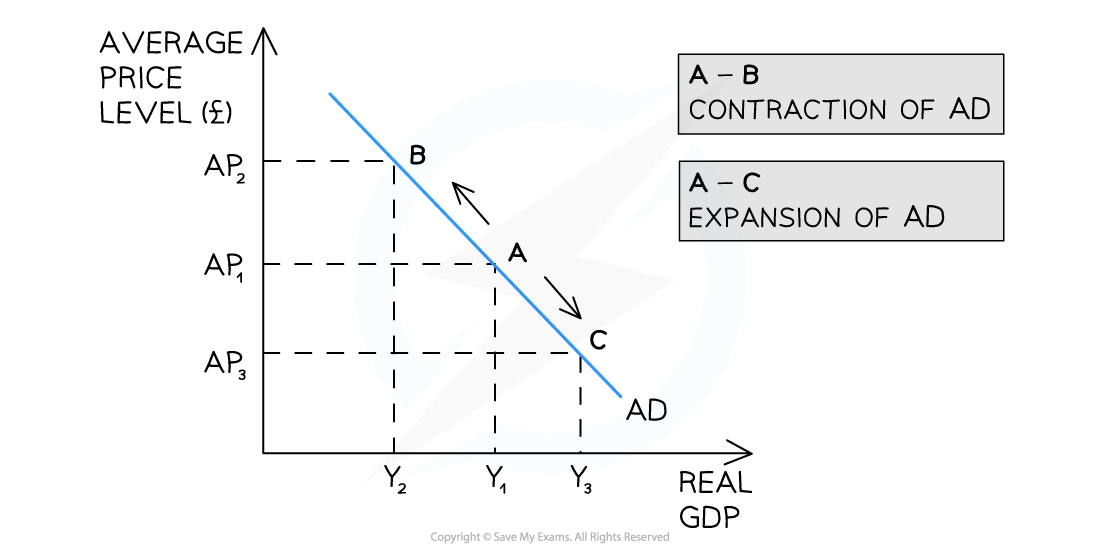
- Whenever there is a change in the average price level (AP) in an economy, there is a movement along the aggregate demand (AD) curve

An increase or decrease in the average price level (AP) causes a movement along the aggregate demand (AD) curve leading to a contraction or expansion of AD
Diagram Analysis
- An increase in the AP (ceteris paribus) from AP1 → AP2 leads to a movement along the AD curve from A → B
- There is a contraction of real GDP from Y1 → Y2
- Y is the symbol used in macroeconomics to denote national income or real GDP
- Y is the symbol used in macroeconomics to denote national income or real GDP
- There is a contraction of real GDP from Y1 → Y2
- A decrease in the AP (ceteris paribus) from AP1 → AP3 leads to a movement along the AD curve from A → C
- There is an expansion of real GDP (output) from Y1 → Y3
Shifts of the Entire AD Curve
- Whenever there is a change in any of the non-price determinants of aggregate demand (AD) in an economy, there is a shift of the entire AD curve

A shift in the entire aggregate demand (AD) curve occurs when there is a change in one of the determinants of AD
Diagram Analysis
- An increase in any one of the non-price determinants of aggregate demand (AD) results in a shift right of the entire curve from AD1 → AD2
- At every price level, real GDP has increased from Y1 → Y2
- At every price level, real GDP has increased from Y1 → Y2
- A decrease in any one of the non-price determinants of AD results in a shift left of the entire curve from AD1 → AD3
- At every price level, real GDP has decreased from Y1 → Y3
- At every price level, real GDP has decreased from Y1 → Y3
Factors that Influence each Component of AD
- Each component of AD is influenced by numerous factors
- A change to any of these factors will potentially change AD
- Consumption is influenced by changes to consumer confidence, interest rates, wealth, income taxes, level of household indebtedness, and expectations of future price level
- Investment is influenced by changes to interest rates, business confidence, technology, business taxes, and the level of corporate indebtedness
- Government spending is influenced by changes to political and economic priorities
- Net exports are influenced by changes to the income of trading partners, exchange rates, and trade policies
Factors that Influence Consumption
Component |
Influence on the component |
Explanation |
|
Consumption |
|
|
|
|
|
|
|
|
|
|
|
|
|
|
|
|
Factors that Influence Investment
Component |
Influence on the component |
Explanation |
|
Investment |
|
|
|
|
|
|
|
|
|
|
|
|
|
Factors that Influence Government Spending
Component |
Influence on the component |
Explanation |
|
Government spending |
|
|
|
|
Factors that Influence Net Exports
Component |
Influence on the component |
Explanation |
|
(Exports - Imports) |
|
|
|
|
|
|
|