The SRAS Curve
- Aggregate supply is the total supply of goods/services produced within an economy at a specific price level at a given time
- The short run is a period in which wages and other factor prices are inflexible
- The long run is a period in which there is full wage and factor price flexibility

A diagram showing the upward sloping short run aggregate supply (SRAS) curve for an economy
- The AS curve is upward sloping due to two reasons
- The aggregate supply is the combined supply of all individual supply curves in an economy which are also upward sloping
- As real output increases, firms have to spend more to increase production e.g. wage bills will increase
- Increased costs result in higher average prices
A Movement Along the SRAS Curve
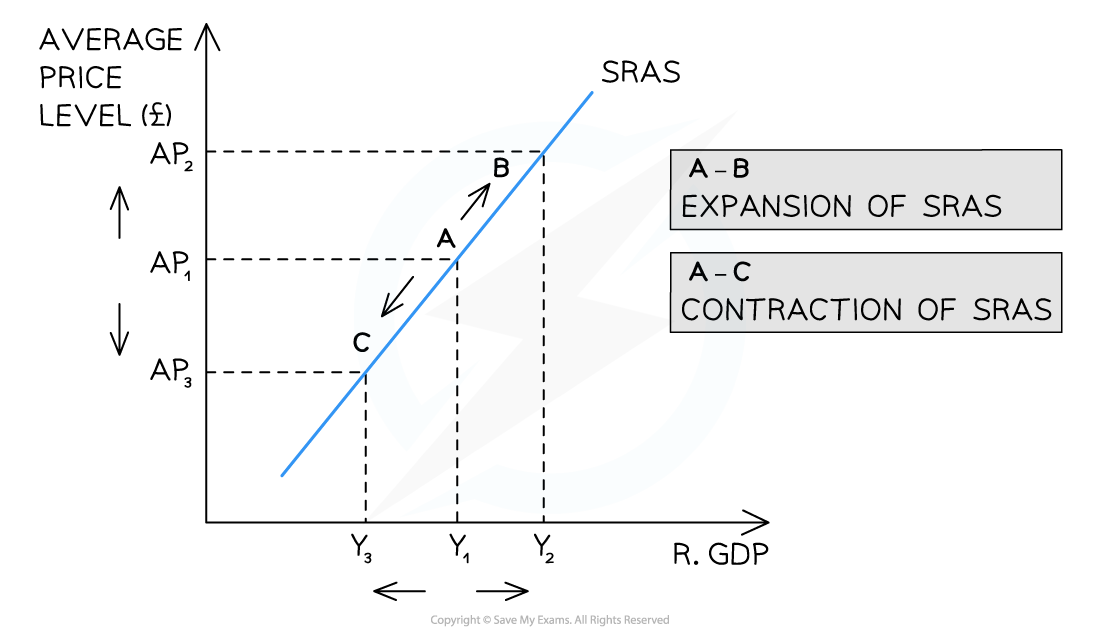
- Whenever there is a change in the average price level (AP) in an economy, there is a movement along the short run aggregate supply (SRAS) curve

An increase or decrease in the average price level (AP) causes a movement along the short run aggregate supply (SRAS) curve leading to a contraction or expansion of the quantity supplied
Diagram Analysis
- An increase in the AP (ceteris paribus) from AP1 → AP2 leads to a movement along the SRAS curve from A → B
- There is an expansion of real GDP from Y1 → Y2
- Y is the symbol used in macroeconomics to denote national income or real GDP
- There is an expansion of real GDP from Y1 → Y2
- A decrease in the AP (ceteris paribus) from AP1 → AP3 leads to a movement along the SRAS curve from A → C
- There is a contraction of real GDP (output) from Y1→Y3
Shifts of the Entire SRAS Curve
- Whenever there is a change in the non-price determinants of supply in an economy (e.g. costs of production or productivity changes), there is a shift of the entire SRAS curve

A shift in the entire short run aggregate supply (SRAS) curve occurs due to a change in one of the non-price determinants of supply
Diagram Analysis
- A decrease in costs or increase in productivity results in a shift right of the entire curve from SRAS1 → SRAS2
- At every price level, output and real GDP have increased from Y1 → Y2
- At every price level, output and real GDP have increased from Y1 → Y2
- An increase in costs or decrease in productivity results in a shift left of the entire curve from SRAS1 → SRAS3
- At every price level, output and real GDP have decreased from Y1 → Y3
The Non-price Determinants of the SRAS Curve
- There are two main factors that can influence the short-run aggregate supply (SRAS). They are
- Changes in costs of raw materials and energy
- Changes in indirect taxes
Explaining the Influences on Short-run Aggregate Supply (SRAS)
| Change in Condition |
Explanation | Impact on SRAS |
|
Changes to the costs of raw materials/energy
|
|
SRAS decreases - shifts left |
|
SRAS increases - shifts right |
|
|
Changes in indirect taxes
|
|
SRAS increases - shifts right |
|
SRAS decreases - shifts left |