| Date | May 2011 | Marks available | 2 | Reference code | 11M.3.sl.TZ2.A2 |
| Level | SL | Paper | 3 | Time zone | TZ2 |
| Command term | Deduce | Question number | A2 | Adapted from | N/A |
Question
Infrared spectroscopy is commonly used as an analytical technique by inorganic, physical and organic chemists.
The IR spectrum, mass spectrum and \(^{\text{1}}{\text{H}}\,{\text{NMR}}\) spectrum of an unknown compound, X, of molecular formula \({{\text{C}}_{\text{5}}}{{\text{H}}_{{\text{10}}}}{{\text{O}}_{\text{2}}}\), are as follows.
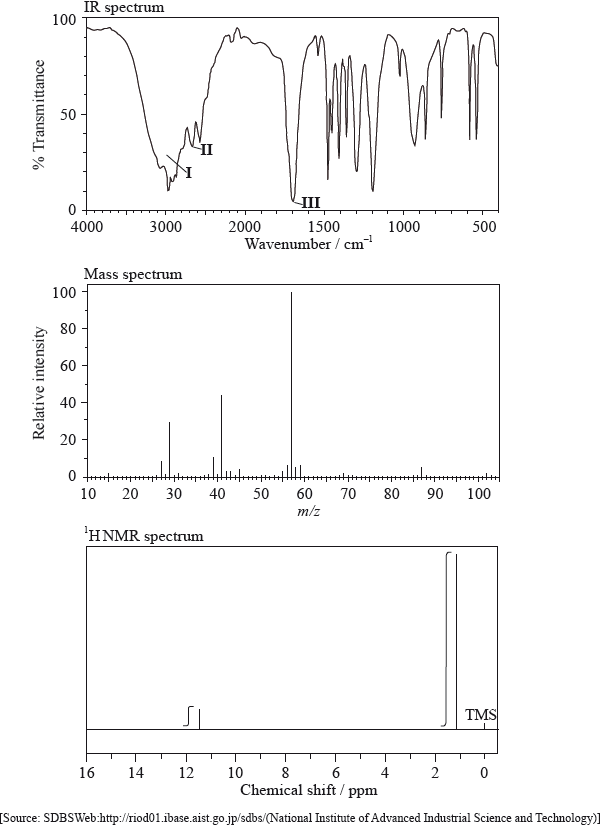
In the IR spectrum, identify the bond responsible for each of the absorptions labelled I, II and III.
I:
II:
III:
In the mass spectrum, deduce which fragments the m/z values at 102, 57 and 45 correspond to.
m/z =102:
m/z = 57:
m/z = 45:
Identify the peak at 11.5 ppm in the \(^{\text{1}}{\text{H}}\,{\text{NMR}}\) spectrum.
State what information can be obtained from the integration traces in the \(^{\text{1}}{\text{H}}\,{\text{NMR}}\) spectrum about the hydrogen atoms responsible for the peak at 1.2 ppm.
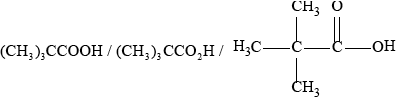
Deduce the structure of X.
\({\text{C}}{{\text{H}}_{\text{3}}}{\text{COOC}}{{\text{H}}_{\text{2}}}{\text{C}}{{\text{H}}_{\text{2}}}{\text{C}}{{\text{H}}_{\text{3}}}\) is an isomer of X. Deduce two differences between the \(^{\text{1}}{\text{H}}\,{\text{NMR}}\) spectrum of this isomer and that of X.
Markscheme
I: O–H;
II: C–H;
III: C=O;
Award [2] for C–H for I and O–H for II.
m/z = 102: molecular ion peak / \({{\text{(C}}{{\text{H}}_3}{\text{)}}_3}{\text{CCOO}}{{\text{H}}^ + }/{{\text{C}}_5}{{\text{H}}_{10}}{\text{O}}_2^ + /{{\text{M}}^ + }\);
m/z = 57: \({{\text{(C}}{{\text{H}}_3}{\text{)}}_3}{{\text{C}}^ + }\) / \({{\text{(M}}–{\text{COOH)}}^ + }\) / \({{\text{C}}_4}{\text{H}}_9^ + \);
m/z = 45: \({\text{COO}}{{\text{H}}^{\text{ + }}}\);
Penalize missing + once only.
(H of) COOH group;
nine hydrogens in the same environment / \({{\text{(C}}{{\text{H}}_3}{\text{)}}_3}{\text{C}}–{\text{(group)}}\);
 ;
;
no peak at 11.5 ppm in spectrum of isomer / different chemical shift values;
four peaks (instead of two) / different number of peaks;
Three of these peaks can be split in actual spectrum, so allow for this in answers if exactly four peaks is not stated.
different integration trace / different areas under the peaks / integration trace would have a 3:2:2:3 peak area ratio;
Do not award mark if incorrect peak area ratios are given for the structure drawn in (v).
Examiners report
In (b) most candidates confused the IR absorptions of O-H and C-H bonds. The positive charge was frequently omitted from the mass spectroscopy fragments and the number of hydrogen atoms in the same chemical environment was often not stated. Most candidates were unable to coordinate all the spectroscopic data to deduce the tertiary structure.
In (b) most candidates confused the IR absorptions of O-H and C-H bonds. The positive charge was frequently omitted from the mass spectroscopy fragments and the number of hydrogen atoms in the same chemical environment was often not stated. Most candidates were unable to coordinate all the spectroscopic data to deduce the tertiary structure.
In (b) most candidates confused the IR absorptions of O-H and C-H bonds. The positive charge was frequently omitted from the mass spectroscopy fragments and the number of hydrogen atoms in the same chemical environment was often not stated. Most candidates were unable to coordinate all the spectroscopic data to deduce the tertiary structure.
In (b) most candidates confused the IR absorptions of O-H and C-H bonds. The positive charge was frequently omitted from the mass spectroscopy fragments and the number of hydrogen atoms in the same chemical environment was often not stated. Most candidates were unable to coordinate all the spectroscopic data to deduce the tertiary structure.
In (b) most candidates confused the IR absorptions of O-H and C-H bonds. The positive charge was frequently omitted from the mass spectroscopy fragments and the number of hydrogen atoms in the same chemical environment was often not stated. Most candidates were unable to coordinate all the spectroscopic data to deduce the tertiary structure.
In (b) most candidates confused the IR absorptions of O-H and C-H bonds. The positive charge was frequently omitted from the mass spectroscopy fragments and the number of hydrogen atoms in the same chemical environment was often not stated. Most candidates were unable to coordinate all the spectroscopic data to deduce the tertiary structure.