Reciprocal Transformations
What effects do reciprocal transformations have on the graphs?
- The x-coordinates stay the same
- The y-coordinates change
- Their values become their reciprocals
- The coordinates (x, y) become
where y ≠ 0
- If y = 0 then a vertical asymptote goes through the original coordinate
- Points that lie on the line y = 1 or the line y = -1 stay the same
How do I sketch the graph of the reciprocal of a function: y = 1/f(x)?
-
Sketch the reciprocal transformation by considering the different features of the original graph
-
Consider key points on the original graph
-
If (x1, y1) is a point on y = f(x) where y1 ≠ 0
-
is a point on
-
If |y1| < 1 then the point gets further away from the x-axis
-
If |y1| > 1 then the point gets closer to the x-axis
-
If y = f(x) has a y-intercept at (0, c) where c ≠ 0
-
The reciprocal graph
has a y-intercept at
-
If y = f(x) has a root at (a, 0)
-
The reciprocal graph
has a vertical asymptote at
-
If y = f(x) has a vertical asymptote at
-
The reciprocal graph
has a discontinuity at (a, 0)
- The discontinuity will look like a root
-
If y = f(x) has a local maximum at (x1, y1) where y1 ≠ 0
-
The reciprocal graph
has a local minimum at
-
If y = f(x) has a local minimum at (x1, y1) where y1 ≠ 0
-
The reciprocal graph
has a local maximum at
-
Consider key regions on the original graph
-
If y = f(x) is positive then
is positive
-
If y = f(x) is negative then
is negative
-
If y = f(x) is increasing then
is decreasing
-
If y = f(x) is decreasing then
is increasing
-
If y = f(x) has a horizontal asymptote at y = k
-
has a horizontal asymptote at
if k ≠ 0
-
tends to ± ∞ if k = 0
-
If y = f(x) tends to ± ∞ as x tends to +∞ or -∞
-
has a horizontal asymptote at
Worked Example
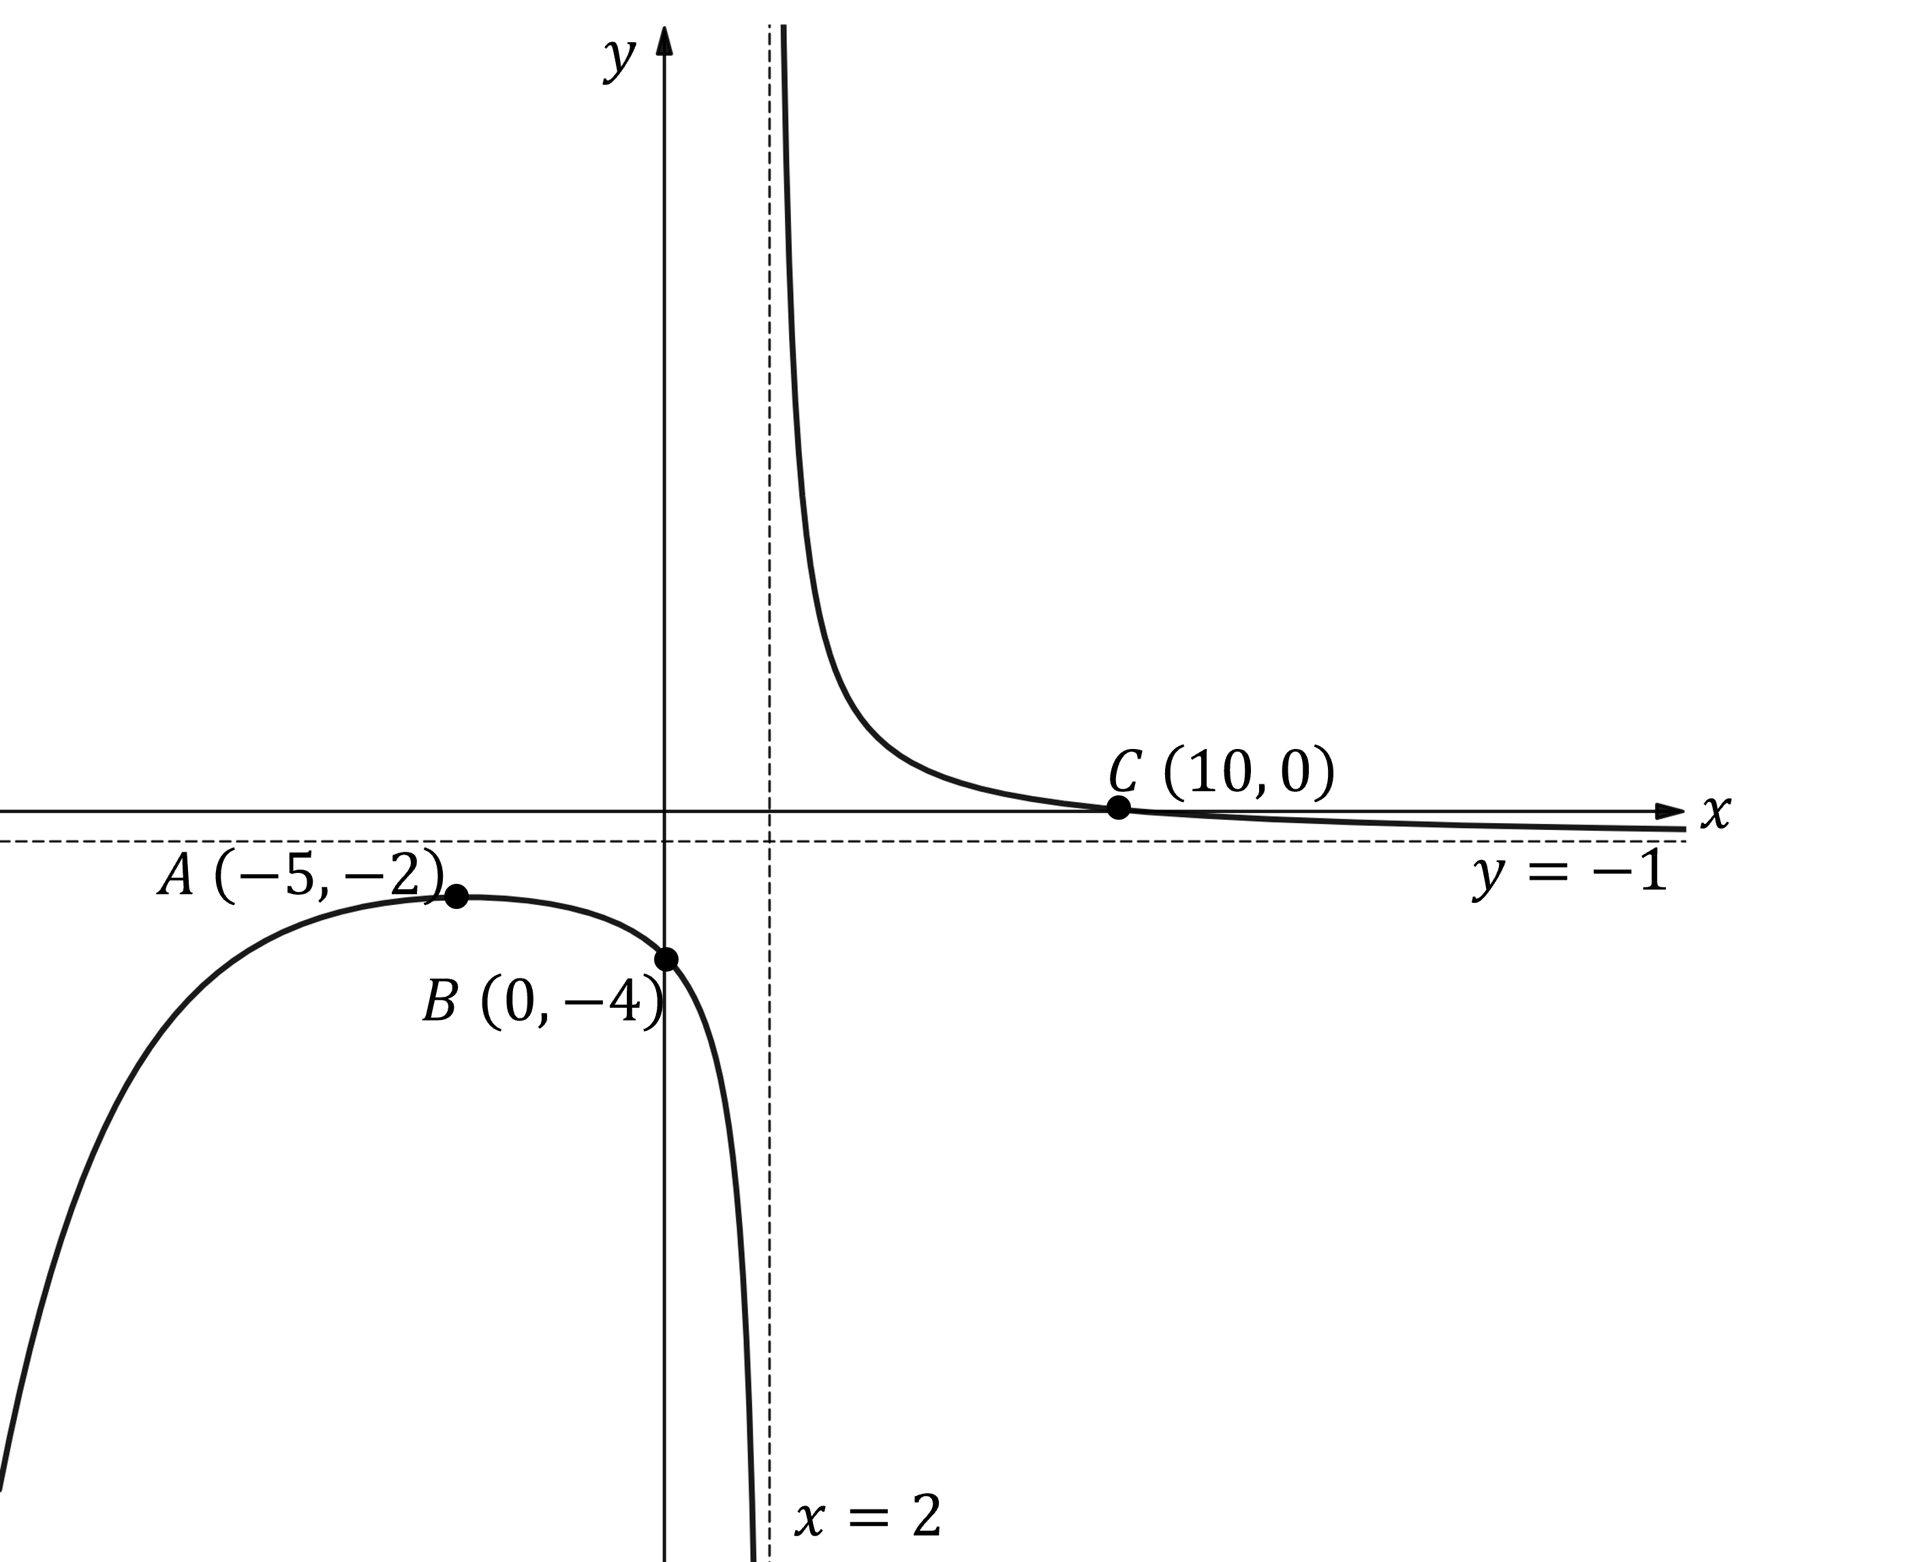
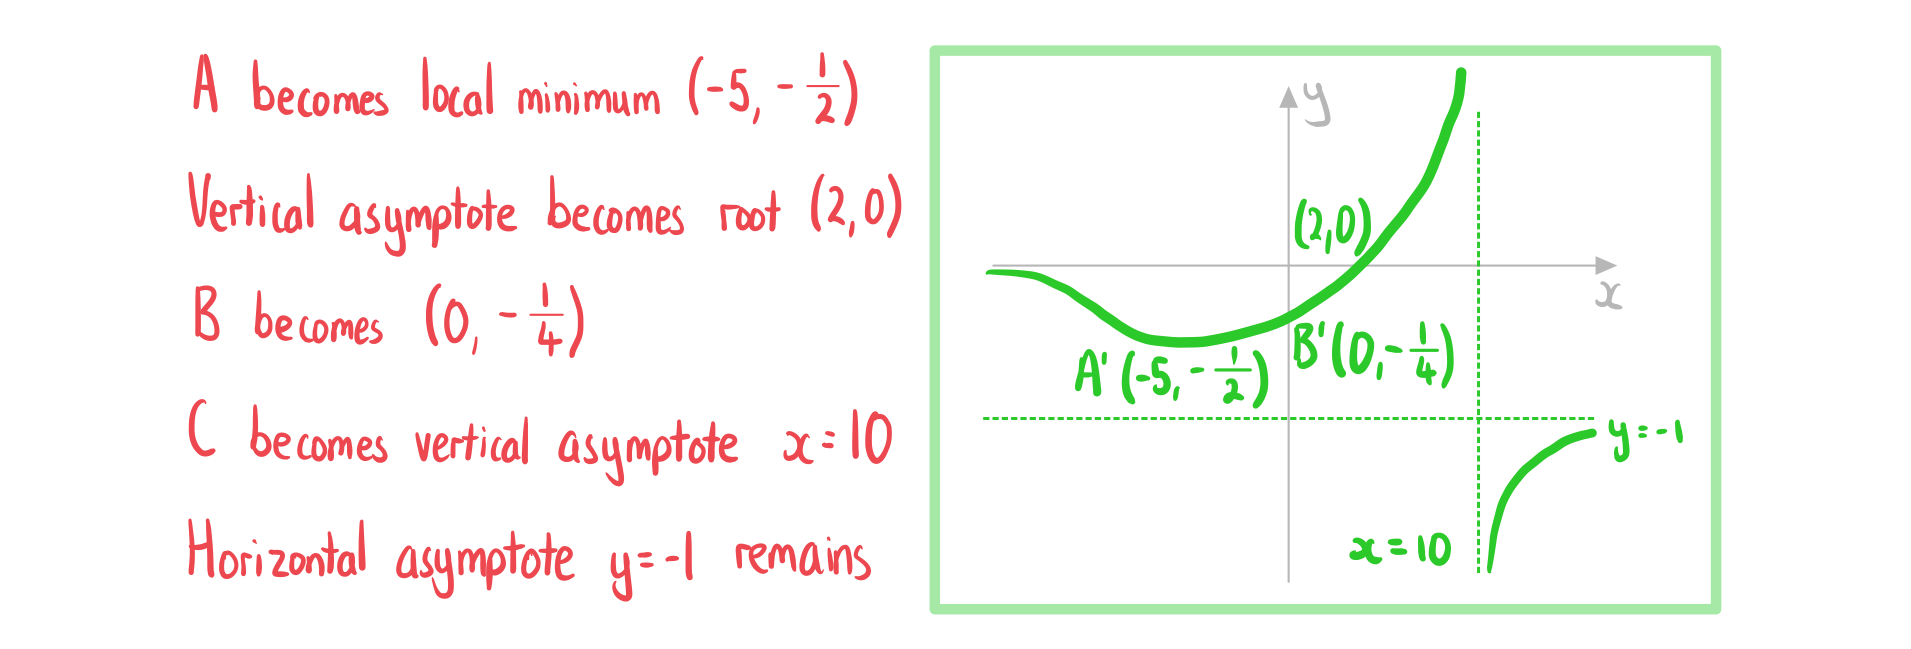
The diagram below shows the graph of which has a local maximum at the point A.

Sketch the graph of ..

Square Transformations
What effects do square transformations have on the graphs?
- The effects are similar to the transformation y = |f(x)|
- The parts below the x-axis are reflected
- The vertical distance between a point and the x-axis is squared
- This has the effect of smoothing the curve at the x-axis
is never below the x-axis
- The x-coordinates stay the same
- The y-coordinates change
- Their values are squared
- The coordinates (x, y) become (x, y²)
- Points that lie on the x-axis or the line y = 1 stay the same
How do I sketch the graph of the square of a function: y = [f(x)]²?
- Sketch the square transformation by considering the different features of the original graph
- Consider key points on the original graph
- If (x1, y1) is a point on y = f(x)
-
is a point on
- If |y1| < 1 then the point gets closer to the x-axis
- If |y1| > 1 then the point gets further away from the x-axis
- If y = f(x) has a y-intercept at (0, c)
- The square graph
has a y-intercept at
- If y = f(x) has a root at (a, 0)
- The square graph
has a root and turning point at (a, 0)
- If y = f(x) has a vertical asymptote at
- The square graph
has a vertical asymptote at
- If y = f(x) has a local maximum at (x1, y1)
- The square graph
has a local maximum at (x1, y12) if y1 > 0
- The square graph
has a local minimum at (x1, y12) if y1 ≤ 0
- If y = f(x) has a local minimum at (x1, y1)
- The square graph
has a local minimum at (x1, y12) if y1 ≥ 0
- The square graph
has a local maximum at (x1, y12) if y1 < 0
Exam Tip
- In an exam question when sketching
make it clear that the points where the new graph touches the x-axis are smooth
- This will make it clear to the examiner that you understand the difference between the roots of the graphs
and
- This will make it clear to the examiner that you understand the difference between the roots of the graphs
Worked Example
The diagram below shows the graph of which has a local maximum at the point A.

Sketch the graph of .

