| Date | May 2017 | Marks available | 2 | Reference code | 17M.1.hl.TZ1.6 |
| Level | HL only | Paper | 1 | Time zone | TZ1 |
| Command term | Sketch | Question number | 6 | Adapted from | N/A |
Question
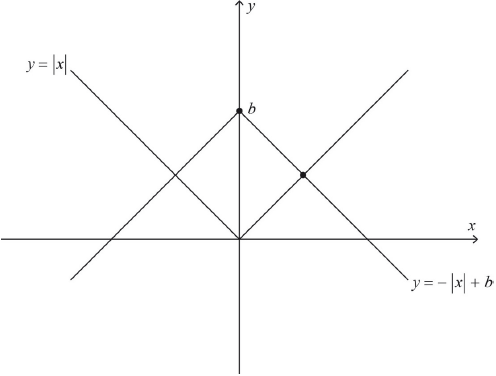
Consider the graphs of \(y = \left| x \right|\) and \(y = - \left| x \right| + b\), where \(b \in {\mathbb{Z}^ + }\).
Sketch the graphs on the same set of axes.
[2]
a.
Given that the graphs enclose a region of area 18 square units, find the value of b.
[3]
b.
Markscheme
graphs sketched correctly (condone missing b) A1A1
[2 marks]
a.
\(\frac{{{b^2}}}{2} = 18\) (M1)A1
\(b = 6\) A1
[3 marks]
b.
Examiners report
[N/A]
a.
[N/A]
b.
Syllabus sections
Show 60 related questions
- 17M.1.hl.TZ1.11e: Sketch the graph of \(y = f\left( {\left| x \right|} \right)\).
- 17M.1.hl.TZ1.11c: Show that \(\frac{1}{{x + 1}} - \frac{1}{{x + 2}} = \frac{1}{{{x^2} + 3x + 2}}\).
- 17M.1.hl.TZ1.11b: Sketch the graph of \(f(x)\), indicating on it the equations of the asymptotes, the...
- 17M.1.hl.TZ1.11a.ii: Factorize \({x^2} + 3x + 2\).
- 17M.1.hl.TZ1.11a.i: Express \({x^2} + 3x + 2\) in the form \({(x + h)^2} + k\).
- 17M.1.hl.TZ2.9a.iii: Showing any \(x\) and \(y\) intercepts, any maximum or minimum points and any asymptotes,...
- 17M.1.hl.TZ2.9a.ii: Showing any \(x\) and \(y\) intercepts, any maximum or minimum points and any asymptotes,...
- 17M.1.hl.TZ2.9a.i: Showing any \(x\) and \(y\) intercepts, any maximum or minimum points and any asymptotes,...
- 17M.2.hl.TZ1.12b: Sketch the graph of \(y = f(x)\) showing clearly the equations of asymptotes and the...
- 17M.2.hl.TZ1.5a: Find the probability that the carpet laid in the first room has fewer than three faults.
- 17M.1.hl.TZ1.6b: Given that the graphs enclose a region of area 18 square units, find the value of b.
- 15N.1.hl.TZ0.12e: Sketch the graph of \(y = f(x)\) indicating clearly the coordinates of the \(x\)-intercepts...
- 13M.2.hl.TZ1.12a: Sketch the graph of \({v_A} = {t^3} - 5{t^2} + 6t\) for \(t \geqslant 0\), with \({v_A}\) on...
- 12M.1.hl.TZ1.2a: Draw the graph of y = f (x) on the blank grid below.
- 12M.2.hl.TZ1.11a: Write down the coordinates of the minimum point on the graph of f .
- 12M.2.hl.TZ1.11c: Find the coordinates of the point, on \(y = f(x)\) , where the gradient of the graph is 3.
- 12M.1.hl.TZ2.7a: On the axes below, sketch the graph of \(y = \frac{1}{{f(x)}}\) , clearly showing...
- 12M.1.hl.TZ2.11a: State the range of f and of g .
- 12M.2.hl.TZ2.6a: Sketch the curve...
- 12M.2.hl.TZ2.12b: Sketch the graph of v against t , clearly showing the coordinates of any intercepts, and the...
- 12N.1.hl.TZ0.3a: Using the information shown in the diagram, find the values of a , b and c .
- 08M.2.hl.TZ1.2: (a) Sketch the curve...
- 08M.2.hl.TZ2.8: The graph of \(y = f(x){\text{ for }} - 2 \leqslant x \leqslant 8\) is shown. On the...
- 08N.2.hl.TZ0.6: (a) Sketch the curve \(y = \left| {\ln x} \right| - \left| {\cos x} \right| - 0.1\) ,...
- 11M.1.hl.TZ2.3a: Sketch the graph of the function. You are not required to find the coordinates of the maximum.
- 11M.1.hl.TZ2.5a: Sketch the graph of \(y = \frac{1}{{f(x)}}\).
- 11M.1.hl.TZ2.5b: Sketch the graph of \(y = x{\text{ }}f(x)\) .
- 11M.2.hl.TZ2.5: Sketch the graph of \(f(x) = x + \frac{{8x}}{{{x^2} - 9}}\). Clearly mark the coordinates of...
- 09M.1.hl.TZ2.11: A function is defined as \(f(x) = k\sqrt x \), with \(k > 0\) and \(x \geqslant 0\) . (a)...
- SPNone.1.hl.TZ0.9b: Sketch the graph of f , showing clearly the coordinates of the maximum and minimum.
- SPNone.1.hl.TZ0.9c: Hence show that \({{\text{e}}^\pi } > {\pi ^{\text{e}}}\) .
- 13M.1.hl.TZ1.12c: Sketch the graph of \(y = f(x)\).
- 13M.2.hl.TZ1.12b: Write down the times for which the velocity of the particle is increasing.
- 13M.2.hl.TZ1.12c: Write down the times for which the magnitude of the velocity of the particle is increasing.
- 10M.1.hl.TZ1.5: The graph of \(y = \frac{{a + x}}{{b + cx}}\) is drawn below. (a) Find the value...
- 10N.2.hl.TZ0.8: The diagram shows the graphs of a linear function f and a quadratic function g. On...
- 13M.1.hl.TZ2.12e: (i) On a different diagram, sketch the graph of \(y = f(|x|)\) where \(x \in D\). (ii) ...
- 13M.2.hl.TZ2.13c: Sketch the graph of \(\theta \), for \(0 \leqslant x \leqslant 20\).
- 11N.1.hl.TZ0.4a: sketch the graph of \(f\);
- 11N.2.hl.TZ0.1a: Sketch the graph, clearly labelling the x and y intercepts with their values.
- SPNone.2.hl.TZ0.6: The function f is of the form \(f(x) = \frac{{x + a}}{{bx + c}}\), \(x \ne - \frac{c}{b}\)....
- 11M.1.hl.TZ1.12d: Now consider the functions \(g(x) = \frac{{\ln \left| x \right|}}{x}\) and...
- 11M.1.hl.TZ1.10b: On the axes below, sketch the graph of \(y = g(x)\) . On the graph, indicate any asymptotes...
- 14M.2.hl.TZ1.10a: Find the equations of the horizontal and vertical asymptotes of the curve \(y = f(x)\).
- 14M.2.hl.TZ1.12: Let \(f(x) = \left| x \right| - 1\). (a) The graph of \(y = g(x)\) is drawn...
- 14M.1.hl.TZ2.5a: Sketch the graph of \(y = \left| {\cos \left( {\frac{x}{4}} \right)} \right|\) for...
- 14M.2.hl.TZ2.7a: (i) Sketch the graph of \(y = f(x)\), clearly indicating any asymptotes and axes...
- 14M.2.hl.TZ2.14a: Sketch the graph of \(y = v(t)\). Indicate clearly the local maximum and write down its...
- 13N.1.hl.TZ0.3b: State the range of \({f^{ - 1}}\).
- 13N.2.hl.TZ0.3a: Sketch the graph of \(y = f(x)\), stating the coordinates of any maximum and minimum points...
- 17N.2.hl.TZ0.10b: Sketch the graph of \(y = f(x)\) showing clearly the minimum point and any asymptotic behaviour.
- 17N.1.hl.TZ0.6a: Sketch the graph of \(y = \frac{{1 - 3x}}{{x - 2}}\), showing clearly any asymptotes and...
- 15M.1.hl.TZ1.11c: Find the coordinates of any local maximum and minimum points on the graph of...
- 15M.1.hl.TZ1.11d: Find the coordinates of any points of inflexion on the graph of \(y(x)\). Justify whether any...
- 15M.1.hl.TZ2.10a: Sketch the graph of \(y = f(x)\), indicating clearly any asymptotes and points of...
- 15M.2.hl.TZ1.11a: Sketch the graph \(y = f(x)\).
- 15M.2.hl.TZ2.3a: Sketch the graph of...
- 15M.2.hl.TZ2.12b: Sketch a displacement/time graph for the particle, \(0 \le t \le 5\), showing clearly where...
- 14N.1.hl.TZ0.1b: State the equations of the asymptotes of the graph of \(g\).
- 14N.3sp.hl.TZ0.1a: Sketch the graph of \(y = f(x)\).