| Date | November 2013 | Marks available | 5 | Reference code | 13N.2.hl.TZ0.3 |
| Level | HL only | Paper | 2 | Time zone | TZ0 |
| Command term | Sketch | Question number | 3 | Adapted from | N/A |
Question
Consider \(f(x) = \ln x - {{\text{e}}^{\cos x}},{\text{ }}0 < x \leqslant 10\).
Sketch the graph of \(y = f(x)\), stating the coordinates of any maximum and minimum points and points of intersection with the x-axis.
Solve the inequality \(\ln x \leqslant {{\text{e}}^{\cos x}},{\text{ }}0 < x \leqslant 10\).
Markscheme
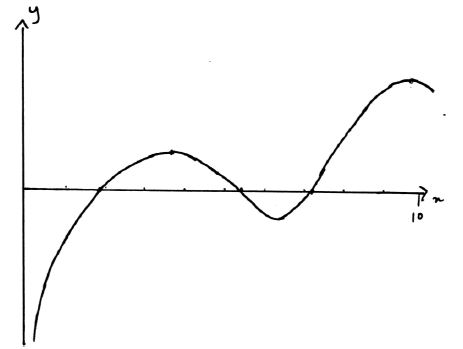
A correct graph shape for \(0 < x \leqslant 10\) A1
maxima (3.78, 0.882) and (9.70, 1.89) A1
minimum (6.22, –0.885) A1
x-axis intercepts (1.97, 0), (5.24, 0) and (7.11, 0) A2
Note: Award A1 if two x-axis intercepts are correct.
[5 marks]
\(0 < x \leqslant 1.97\) A1
\(5.24 \leqslant x \leqslant 7.11\) A1
[2 marks]
Examiners report
Part (a) was reasonably well done although more care was required when showing correct endpoint behaviour. A number of sketch graphs suggested the existence of either a vertical axis intercept or displayed an open circle on the vertical axis. A large number of candidates did not state the coordinates of the various key features correct to three significant figures. A large number of candidates did not locate the maximum near \(x = 10\). Most candidates were able to locate the x-axis intercepts and the minimum. A few candidates unfortunately sketched a graph from a GDC set in degrees.
In part (b), a number of candidates identified the correct critical values but used incorrect inequality signs. Some candidates attempted to solve the inequality algebraically.