| Date | May 2012 | Marks available | 4 | Reference code | 12M.1.sl.TZ1.5 |
| Level | SL only | Paper | 1 | Time zone | TZ1 |
| Command term | Find, Show that, and Hence | Question number | 5 | Adapted from | N/A |
Question
The diagram below shows part of the graph of \(f(x) = a\cos (b(x - c)) - 1\) , where \(a > 0\) .
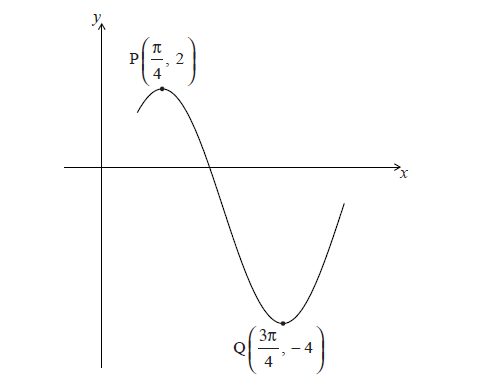
The point \({\rm{P}}\left( {\frac{\pi }{4},2} \right)\) is a maximum point and the point \({\rm{Q}}\left( {\frac{{3\pi }}{4}, - 4} \right)\) is a minimum point.
Find the value of a .
(i) Show that the period of f is \(\pi \) .
(ii) Hence, find the value of b .
Given that \(0 < c < \pi \) , write down the value of c .
Markscheme
evidence of valid approach (M1)
e.g. \(\frac{{{\text{max }}y{\text{ value}} - {\text{min }}y{\text{ value}}}}{2}\) , distance from \(y = - 1\)
\(a = 3\) A1 N2
[2 marks]
(i) evidence of valid approach (M1)
e.g. finding difference in x-coordinates, \(\frac{\pi }{2}\)
evidence of doubling A1
e.g. \(2 \times \left( {\frac{\pi }{2}} \right)\)
\({\text{period}} = \pi \) AG N0
(ii) evidence of valid approach (M1)
e.g. \(b = \frac{{2\pi }}{\pi }\)
\(b = 2\) A1 N2
[4 marks]
\(c = \frac{\pi }{4}\) A1 N1
[1 mark]
Examiners report
A pleasing number of candidates correctly found the values of a, b, and c for this sinusoidal graph.
A pleasing number of candidates correctly found the values of a, b, and c for this sinusoidal graph. Some candidates had trouble showing that the period was \(\pi \) , either incorrectly adding the given \(\pi /4\) and \(3\pi /4\) or using the value of b that they found first for part (b)(ii).
A pleasing number of candidates correctly found the values of a, b, and c for this sinusoidal graph. Some candidates had trouble showing that the period was \(\pi \) , either incorrectly adding the given \(\pi /4\) and \(\pi /3\) or using the value of b that they found first for part (b)(ii).