| Date | None Specimen | Marks available | 3 | Reference code | SPNone.2.sl.TZ0.10 |
| Level | SL only | Paper | 2 | Time zone | TZ0 |
| Command term | Find | Question number | 10 | Adapted from | N/A |
Question
A rock falls off the top of a cliff. Let \(h\) be its height above ground in metres, after \(t\) seconds.
The table below gives values of \(h\) and \(t\) .
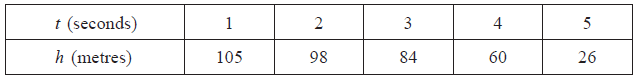
Jane thinks that the function \(f(t) = - 0.25{t^3} - 2.32{t^2} + 1.93t + 106\) is a suitable model for the data. Use Jane’s model to
(i) write down the height of the cliff;
(ii) find the height of the rock after 4.5 seconds;
(iii) find after how many seconds the height of the rock is \(30{\text{ m}}\).
Kevin thinks that the function \(g(t) = - 5.2{t^2} + 9.5t + 100\) is a better model for the data. Use Kevin’s model to find when the rock hits the ground.
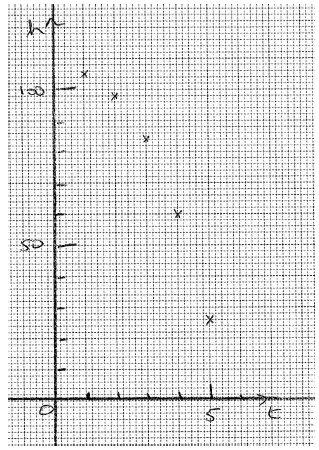
(i) On graph paper, using a scale of 1 cm to 1 second, and 1 cm to 10 m, plot the data given in the table.
(ii) By comparing the graphs of f and g with the plotted data, explain which function is a better model for the height of the falling rock.
Markscheme
(i) \(106{\text{ m}}\) A1 N1
(ii) substitute \(t = 4.5\) M1
\(h = 44.9{\text{ m}}\) A1 N2
(iii) set up suitable equation M1
e.g. \(f(t) = 30\)
\(t = 4.91\) A1 N1
[5 marks]
recognizing that height is 0 A1
set up suitable equation M1
e.g. \(g(t) = 0\)
\(t = 5.39{\text{ secs}}\) A1 N2
[3 marks]
 A1A2 N3
Note: Award A1 for correct scales on axes, A2 for 5 correct points, A1 for 3 or 4 correct points.
(ii) Jane’s function, with 2 valid reasons A1R1R1 N3
e.g. Jane’s passes very close to all the points, Kevin’s has the rock clearly going up initially – not possible if rock falls
Note: Although Jane’s also goes up initially, it only goes up very slightly, and so is the better model.
[6 marks]