State the number of significant figures associated with the mass of phenyl benzoate obtained and calculate the percentage uncertainty associated with this mass.
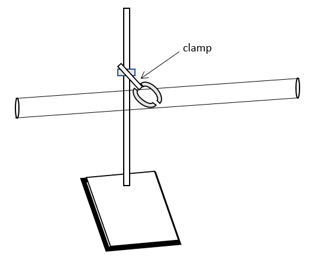
A student investigated the diffusion of ammonia and hydrogen chloride gases in a 1.00 m glass tube. She placed cotton wool plugs containing concentrated ammonia and hydrochloric acid at either end of the tube and sealed the ends with stoppers.
Where the two gases meet a white smoke ring of ammonium chloride, NH4Cl, appears. The student recorded the time taken for the white smoke to appear and the distance travelled by each gas.
1st trial
2nd trial
3rd trial
Total time elapsed /s
126
114
163
Distance travelled by NH3 (g) / cm
72
68
75
Distance travelled by HCl (g) / cm
28
32
25
The rate of diffusion of a gas is proportional to the square root of the mass of its particles.
Calculate the mean rate of diffusion of ammonia and hydrogen chloride, expressing your answer to an appropriate number of significant figures.
The student cleans and dries the glass tube between each run of the experiment. If the glass tube is not completely dry, state what type of error can occur and what its impact on the results would be.

format('truetype')%3Bfont-weight%3Anormal%3Bfont-style%3Anormal%3B%7D%3C%2Fstyle%3E%3C%2Fdefs%3E%3Ctext%20font-family%3D%22Arial%22%20font-size%3D%2214%22%20text-anchor%3D%22middle%22%20x%3D%2215.5%22%20y%3D%2223%22%3ERate%3C%2Ftext%3E%3Ctext%20font-family%3D%22math17f39f8317fbdb1988ef4c628eb%22%20font-size%3D%2214%22%20text-anchor%3D%22middle%22%20x%3D%2242.5%22%20y%3D%2223%22%3E%3D%3C%2Ftext%3E%3Cline%20stroke%3D%22%23000000%22%20stroke-linecap%3D%22square%22%20stroke-width%3D%221%22%20x1%3D%2256.5%22%20x2%3D%2288.5%22%20y1%3D%2218.5%22%20y2%3D%2218.5%22%2F%3E%3Ctext%20font-family%3D%22Arial%22%20font-size%3D%2214%22%20text-anchor%3D%22middle%22%20x%3D%2273.5%22%20y%3D%2213%22%3E1%3C%2Ftext%3E%3Cpolyline%20fill%3D%22none%22%20points%3D%229%2C-18%209%2C-18%204%2C0%201%2C-7%22%20stroke%3D%22%23000000%22%20stroke-linecap%3D%22square%22%20stroke-width%3D%221%22%20transform%3D%22translate(57.5%2C42.5)%22%2F%3E%3Cpolyline%20fill%3D%22none%22%20points%3D%224%2C0%201%2C-7%200%2C-6%22%20stroke%3D%22%23000000%22%20stroke-linecap%3D%22square%22%20stroke-width%3D%221%22%20transform%3D%22translate(57.5%2C42.5)%22%2F%3E%3Cline%20stroke%3D%22%23000000%22%20stroke-linecap%3D%22square%22%20stroke-width%3D%221%22%20x1%3D%2267.5%22%20x2%3D%2287.5%22%20y1%3D%2224.5%22%20y2%3D%2224.5%22%2F%3E%3Ctext%20font-family%3D%22Arial%22%20font-size%3D%2214%22%20font-style%3D%22italic%22%20text-anchor%3D%22middle%22%20x%3D%2275.5%22%20y%3D%2237%22%3EM%3C%2Ftext%3E%3Ctext%20font-family%3D%22Arial%22%20font-size%3D%2210%22%20font-style%3D%22italic%22%20text-anchor%3D%22middle%22%20x%3D%2283.5%22%20y%3D%2241%22%3Er%3C%2Ftext%3E%3C%2Fsvg%3E)
format('truetype')%3Bfont-weight%3Anormal%3Bfont-style%3Anormal%3B%7D%3C%2Fstyle%3E%3C%2Fdefs%3E%3Cline%20stroke%3D%22%23000000%22%20stroke-linecap%3D%22square%22%20stroke-width%3D%221%22%20x1%3D%222.5%22%20x2%3D%2240.5%22%20y1%3D%2230.5%22%20y2%3D%2230.5%22%2F%3E%3Ctext%20font-family%3D%22Arial%22%20font-size%3D%2214%22%20text-anchor%3D%22middle%22%20x%3D%2218.5%22%20y%3D%2221%22%3ERate%3C%2Ftext%3E%3Ctext%20font-family%3D%22Arial%22%20font-size%3D%2210%22%20text-anchor%3D%22middle%22%20x%3D%2236.5%22%20y%3D%2225%22%3EA%3C%2Ftext%3E%3Ctext%20font-family%3D%22Arial%22%20font-size%3D%2214%22%20text-anchor%3D%22middle%22%20x%3D%2218.5%22%20y%3D%2245%22%3ERate%3C%2Ftext%3E%3Ctext%20font-family%3D%22Arial%22%20font-size%3D%2210%22%20text-anchor%3D%22middle%22%20x%3D%2236.5%22%20y%3D%2249%22%3EB%3C%2Ftext%3E%3Ctext%20font-family%3D%22math17f39f8317fbdb1988ef4c628eb%22%20font-size%3D%2214%22%20text-anchor%3D%22middle%22%20x%3D%2251.5%22%20y%3D%2235%22%3E%3D%3C%2Ftext%3E%3Cline%20stroke%3D%22%23000000%22%20stroke-linecap%3D%22square%22%20stroke-width%3D%221%22%20x1%3D%2265.5%22%20x2%3D%22104.5%22%20y1%3D%2230.5%22%20y2%3D%2230.5%22%2F%3E%3Cpolyline%20fill%3D%22none%22%20points%3D%229%2C-22%209%2C-22%204%2C0%201%2C-9%22%20stroke%3D%22%23000000%22%20stroke-linecap%3D%22square%22%20stroke-width%3D%221%22%20transform%3D%22translate(66.5%2C26.5)%22%2F%3E%3Cpolyline%20fill%3D%22none%22%20points%3D%224%2C0%201%2C-9%200%2C-8%22%20stroke%3D%22%23000000%22%20stroke-linecap%3D%22square%22%20stroke-width%3D%221%22%20transform%3D%22translate(66.5%2C26.5)%22%2F%3E%3Cline%20stroke%3D%22%23000000%22%20stroke-linecap%3D%22square%22%20stroke-width%3D%221%22%20x1%3D%2276.5%22%20x2%3D%22103.5%22%20y1%3D%224.5%22%20y2%3D%224.5%22%2F%3E%3Ctext%20font-family%3D%22Arial%22%20font-size%3D%2214%22%20font-style%3D%22italic%22%20text-anchor%3D%22middle%22%20x%3D%2284.5%22%20y%3D%2217%22%3EM%3C%2Ftext%3E%3Ctext%20font-family%3D%22Arial%22%20font-size%3D%2210%22%20font-style%3D%22italic%22%20text-anchor%3D%22middle%22%20x%3D%2292.5%22%20y%3D%2221%22%3Er%3C%2Ftext%3E%3Ctext%20font-family%3D%22Arial%22%20font-size%3D%2210%22%20text-anchor%3D%22middle%22%20x%3D%2298.5%22%20y%3D%2225%22%3EB%3C%2Ftext%3E%3Cpolyline%20fill%3D%22none%22%20points%3D%229%2C-22%209%2C-22%204%2C0%201%2C-9%22%20stroke%3D%22%23000000%22%20stroke-linecap%3D%22square%22%20stroke-width%3D%221%22%20transform%3D%22translate(66.5%2C58.5)%22%2F%3E%3Cpolyline%20fill%3D%22none%22%20points%3D%224%2C0%201%2C-9%200%2C-8%22%20stroke%3D%22%23000000%22%20stroke-linecap%3D%22square%22%20stroke-width%3D%221%22%20transform%3D%22translate(66.5%2C58.5)%22%2F%3E%3Cline%20stroke%3D%22%23000000%22%20stroke-linecap%3D%22square%22%20stroke-width%3D%221%22%20x1%3D%2276.5%22%20x2%3D%22103.5%22%20y1%3D%2236.5%22%20y2%3D%2236.5%22%2F%3E%3Ctext%20font-family%3D%22Arial%22%20font-size%3D%2214%22%20font-style%3D%22italic%22%20text-anchor%3D%22middle%22%20x%3D%2284.5%22%20y%3D%2249%22%3EM%3C%2Ftext%3E%3Ctext%20font-family%3D%22Arial%22%20font-size%3D%2210%22%20font-style%3D%22italic%22%20text-anchor%3D%22middle%22%20x%3D%2292.5%22%20y%3D%2253%22%3Er%3C%2Ftext%3E%3Ctext%20font-family%3D%22Arial%22%20font-size%3D%2210%22%20text-anchor%3D%22middle%22%20x%3D%2298.5%22%20y%3D%2257%22%3EA%3C%2Ftext%3E%3C%2Fsvg%3E)