| Date | May 2010 | Marks available | 8 | Reference code | 10M.2.sl.TZ1.2 |
| Level | SL | Paper | 2 | Time zone | TZ1 |
| Command term | Annotate, Describe, Discuss, Explain, and Sketch | Question number | 2 | Adapted from | N/A |
Question
Alex and Hannah were asked to investigate the kinetics involved in the iodination of propanone. They were given the following equation by their teacher.
\[{\text{C}}{{\text{H}}_3}{\text{COC}}{{\text{H}}_3}{\text{(aq)}} + {{\text{I}}_2}{\text{(aq)}}\xrightarrow{{{{\text{H}}^ + }{\text{(aq)}}}}{\text{C}}{{\text{H}}_2}{\text{ICOC}}{{\text{H}}_3}{\text{(aq)}} + {\text{HI(aq)}}\]
Alex’s hypothesis was that the rate will be affected by changing the concentrations of the propanone and the iodine, as the reaction can happen without a catalyst. Hannah’s hypothesis was that as the catalyst is involved in the reaction, the concentrations of the propanone, iodine and the hydrogen ions will all affect the rate.
They carried out several experiments varying the concentration of one of the reactants or the catalyst whilst keeping other concentrations and conditions the same. Their results are shown graphically below.

(a) Discuss whether either Alex’s or Hannah’s hypothesis is correct.
(b) Explain why the reaction rate will increase with increasing temperature.
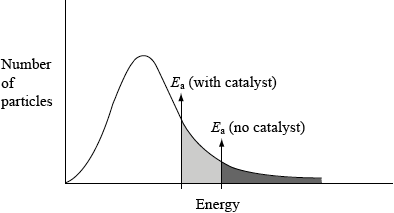
(c) (i) This reaction uses a catalyst. Sketch and annotate the Maxwell-Boltzmann energy distribution curve for a reaction with and without a catalyst on labelled axes below.
(ii) Describe how a catalyst works.
Markscheme
(a) [I2] does not affect rate / OWTTE;
neither correct/both partially correct with explanation as to how;
(b) more particles/molecules have sufficient energy to overcome activation energy / OWTTE;
more frequent collisions;
(c) (i) 
axes correctly labelled x = energy/velocity/speed, y = number/% of molecules/particles;
graph showing correct curve for Maxwell-Boltzmann distribution;
If two curves are drawn, first and second mark can still be scored, but not third.
Curve(s) must begin at origin and not go up at high energy.
two activation energies shown with Ecat shown lower;
Award the mark for the final point if shown on an enthalpy level diagram.
(ii) catalyst provides an alternative pathway of lower energy / OWTTE;
Accept catalyst lowers activation energy (of reaction).
Examiners report
Most of the G2 comments on this question predicted the downfalls in the performance of the candidates. Q2 proved to be poorly answered overall with virtually no candidate scoring full marks. In (a), often the question was not addressed accurately. It appeared that some candidates interpreted the question to imply that one of the hypotheses was correct. Many candidates did however score at least one mark for stating that the concentration of iodine did not affect the rate. In (b), candidates typically understood the basics of the concept. However, the most common error was candidates stating that there are more collisions instead of stating that there are more frequent collisions i.e. some reference to time had to be given which has been commented extensively previously in subject reports. In (c), very few candidates knew how to draw a Maxwell-Boltzmann distribution curve which was very surprising, as this is securely on-syllabus. Many candidates drew an enthalpy-level diagram, others drew two curves and many dropped marks for incorrectly labelled axes or poorly sketched curves. For the latter, the most common mistakes involved symmetric curves, curves not starting at the origin or crossing the x-axis at high energy. In contrast however, (c) (ii) was very well answered with most candidates stating that a catalyst provides an alternative pathway of lower energy. Some candidates stated that a catalyst lowers the activation energy which was also accepted.

