| Date | May 2016 | Marks available | 5 | Reference code | 16M.1.hl.TZ2.2 |
| Level | HL only | Paper | 1 | Time zone | TZ2 |
| Command term | Indicate, Sketch, and State | Question number | 2 | Adapted from | N/A |
Question
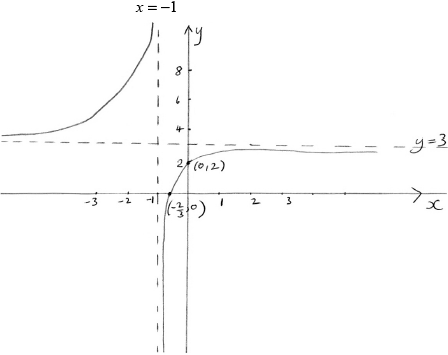
The function \(f\) is defined as \(f(x) = \frac{{3x + 2}}{{x + 1}},{\text{ }}x \in \mathbb{R},{\text{ }}x \ne - 1\).
Sketch the graph of \(y = f(x)\), clearly indicating and stating the equations of any asymptotes and the coordinates of any axes intercepts.
Markscheme
 A1A1A1A1A1
Note: Award A1 for correct shape, A1 for \(x = - 1\) clearly stated and asymptote shown, A1 for \(y = 3\) clearly stated and asymptote shown, A1 for \(\left( { - \frac{2}{3},{\text{ }}0} \right)\) and A1 for \((0,{\text{ }}2)\).
[5 marks]
Examiners report
Another standard question. On this occasion, specific coordinates were asked for, so some otherwise good candidates missed out on a couple of marks which they would have gained through greater care.
Syllabus sections
Topic 2 - Core: Functions and equations » 2.2 » The graph of a function; its equation \(y = f\left( x \right)\) .
Show 56 related questions