| Date | May 2017 | Marks available | 2 | Reference code | 17M.1.sl.TZ2.3 |
| Level | SL only | Paper | 1 | Time zone | TZ2 |
| Command term | Find | Question number | 3 | Adapted from | N/A |
Question
The random variable \(X\) is normally distributed with a mean of 100. The following diagram shows the normal curve for \(X\).
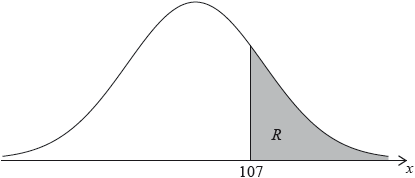
Let \(R\) be the shaded region under the curve, to the right of 107. The area of \(R\) is 0.24.
Write down \({\text{P}}(X > 107)\).
Find \({\text{P}}(100 < X < 107)\).
Find \({\text{P}}(93 < X < 107)\).
Markscheme
\({\text{P}}(X > 107) = 0.24\,\,\,\left( { = \frac{6}{{25}},{\text{ }}24\% } \right)\) A1 N1
[1 mark]
valid approach (M1)
eg\(\,\,\,\,\,\)\({\text{P}}(X > 100) = 0.5,{\text{ P}}(X > 100) - {\text{P}}(X > 107)\)
correct working (A1)
eg\(\,\,\,\,\,\)\(0.5 - 0.24,{\text{ }}0.76 - 0.5\)
\({\text{P}}(100 < X < 107) = 0.26\,\,\,\left( { = \frac{{13}}{{50}},{\text{ }}26\% } \right)\) A1 N2
[3 marks]
valid approach (M1)
eg\(\,\,\,\,\,\)\(2 \times 0.26,{\text{ }}1 - 2(0.24),{\text{ P}}(93 < X < 100) = {\text{P}}(100 < X < 107)\)
\({\text{P}}(93 < X < 107) = 0.52\,\,\,\left( { = \frac{{13}}{{25}},{\text{ }}52\% } \right)\) A1 N2
[2 marks]