| Date | May 2008 | Marks available | 5 | Reference code | 08M.2.sl.TZ2.5 |
| Level | SL only | Paper | 2 | Time zone | TZ2 |
| Command term | Find | Question number | 5 | Adapted from | N/A |
Question
The heights of certain plants are normally distributed. The plants are classified into three categories.
The shortest \(12.92\% \) are in category A.
The tallest \(10.38\% \) are in category C.
All the other plants are in category B with heights between \(r{\text{ cm}}\) and \(t{\text{ cm}}\) .
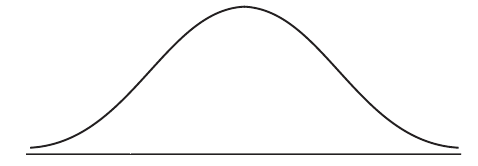
Complete the following diagram to represent this information.

Given that the mean height is \(6.84{\text{ cm}}\) and the standard deviation \(0.25{\text{ cm}}\) , find the value of r and of t.
Markscheme
 A1A1 N2
Notes: Award A1 for three regions (may be shown by lines or shading), A1 for clear labelling of two regions (may be shown by percentages or categories). r and t need not be labelled, but if they are, they may be interchanged.
[2 marks]
METHOD 1
\({\rm{P}}(X < r) = 0.1292\) (A1)
\(r = 6.56\) A1 N2
\(1 - 0.1038\) (= 0.8962) (may be seen later) A1
\({\rm{P}}(X < t) = 0.8962\) (A1)
\(t = 7.16\) A1 N2
METHOD 2
finding z-values \( - 1.130 \ldots{\text{, }}1.260 \ldots \) A1A1
evidence of setting up one standardised equation (M1)
e.g. \(\frac{{r - 6.84}}{{0.25}} = - 1.13 \ldots \) , \(t = 1.260 \times 0.25 + 6.84\)
\(r = 6.56\) , \(t = 7.16\) A1A1 N2N2
[5 marks]
Examiners report
Many candidates shaded or otherwise correctly labelled the appropriate regions in the normal curve.
Although many candidates shaded or otherwise correctly labelled the appropriate regions in the normal curve, far fewer could apply techniques of normal probabilities to achieve correct results in part (b). Many set the standardized formula equal to the probabilities instead of the appropriate z-scores, which can be found either by the use of tables or the GDC. Others simply left this part blank, which suggests a lack of preparation for such “inverse” types of questions in a normal distribution.

