| Date | May 2012 | Marks available | 2 | Reference code | 12M.2.sl.TZ1.8 |
| Level | SL only | Paper | 2 | Time zone | TZ1 |
| Command term | Write down | Question number | 8 | Adapted from | N/A |
Question
The histogram below shows the time T seconds taken by 93 children to solve a puzzle.
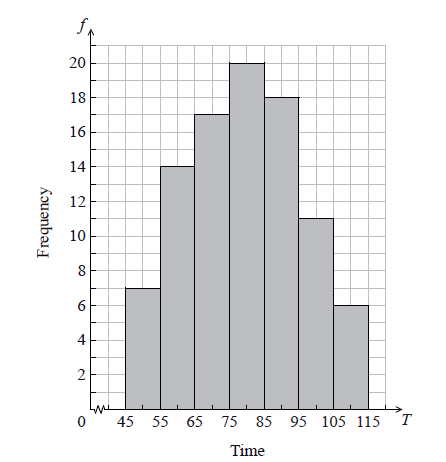
The following is the frequency distribution for T .

(i) Write down the value of p and of q .
(ii) Write down the median class.
A child is selected at random. Find the probability that the child takes less than 95 seconds to solve the puzzle.
Consider the class interval \(45 \le T < 55\) .
(i) Write down the interval width.
(ii) Write down the mid-interval value.
Hence find an estimate for the
(i) mean;
(ii) standard deviation.
John assumes that T is normally distributed and uses this to estimate the probability that a child takes less than 95 seconds to solve the puzzle.
Find John’s estimate.
Markscheme
(i) \(p = 17\) , \(q = 11\) A1A1 N2
(ii) \(75 \le T < 85\) A1 N1
[3 marks]
evidence of valid approach (M1)
e.g. adding frequencies
\(\frac{{76}}{{93}} = 0.8172043 \ldots \)
\({\rm{P}}(T < 95) = \frac{{76}}{{93}} = 0.817\) A1 N2
[2 marks]
(i) 10 A1 N1
(ii) 50 A1 N1
[2 marks]
(i) evidence of approach using mid-interval values (may be seen in part (ii)) (M1)
\(79.1397849\)
\(\overline x = 79.1\) A2 N3
(ii) \(16.4386061\)
\(\sigma = 16.4\) A1 N1
[4 marks]
e.g. standardizing, \(z = 0.9648 \ldots \)
\(0.8326812\)
\({\rm{P}}(T < 95) = 0.833\) A1 N2
[2 marks]
Examiners report
Parts (a) and (b) were generally well done. The terms "median" and "median class" were often confused.
Parts (a) and (b) were generally well done. The terms "median" and "median class" were often confused.
In part (c) some candidates had problems with the term "interval width" and there were some rather interesting mid-interval values noted.
In part (d), candidates often ignored the "hence" command and estimated values from the graph rather than from the information in part (c).
Those who correctly obtained the mean and standard deviation had little difficulty with part (e) although candidates often used unfamiliar calculator notation as their working or used the mid-interval value as the mean of the distribution.