| Date | November 2014 | Marks available | 3 | Reference code | 14N.2.sl.TZ0.2 |
| Level | SL | Paper | 2 | Time zone | TZ0 |
| Command term | Determine | Question number | 2 | Adapted from | N/A |
Question
The graph below shows pressure and volume data collected for a sample of carbon dioxide gas at 330 K.
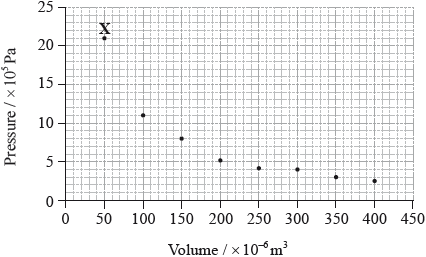
Draw a best-fit curve for the data on the graph.
Deduce the relationship between the pressure and volume of the sample of carbon dioxide gas.
Use the data point labelled X to determine the amount, in mol, of carbon dioxide gas in the sample.
Markscheme
smooth curve through the data;
Do not accept a curve that passes through all of the points or an answer that joins the points using lines.
inversely proportional / \({\text{V}}\alpha \frac{{\text{1}}}{{\text{p}}}\) / \({\text{P}}\alpha \frac{{\text{1}}}{{\text{V}}}\) ;
Accept inverse/negative correlation/relationship.
Do not accept \({\text{V}} = \frac{{\text{1}}}{{\text{p}}}\) / \({\text{P}} = \frac{{\text{1}}}{{\text{V}}}\) or descriptions like “one goes up as other goes down” / OWTTE.
\(p = 21 \times {10^5}/2.1 \times {10^6}{\text{ (Pa)}}/2.1 \times {10^3}{\text{ (kPa)}}\) and
\(V = 50 \times {10^{ - 6}}/5.0 \times {10^{ - 5}}{\text{ }}({{\text{m}}^3})/5.0 \times {10^{ - 2}}{\text{ }}({\text{d}}{{\text{m}}^3})\);
\(\left( {n = \frac{{pV}}{{RT}} = } \right){\text{ }}\frac{{2.1 \times {{10}^6} \times 5.0 \times {{10}^{ - 5}}}}{{8.31 \times 330}}\);
\(n = 0.038{\text{ (mol)}}\);
Award [3] for correct final answer.
For M3 apply ECF for correct computation of the equation the student has written, unless more than one mistake is made prior this point.
Examiners report
Almost all candidates gained the mark for drawing a best-fit curve through the data points on the graph, though some insisted in trying to put a straight line through obviously non-linear data. Many students identified the inverse proportionality of pressure and volume in Part (b), though the terminology often lacked precision. Most students could identify the correct equation to use in Part (c) in order to calculate the amount of gas from the specified data point, though quite often they had problems with units, either as a result of incorrectly reading the axis on the graph or as a result of conversion.
Almost all candidates gained the mark for drawing a best-fit curve through the data points on the graph, though some insisted in trying to put a straight line through obviously non-linear data. Many students identified the inverse proportionality of pressure and volume in Part (b), though the terminology often lacked precision. Most students could identify the correct equation to use in Part (c) in order to calculate the amount of gas from the specified data point, though quite often they had problems with units, either as a result of incorrectly reading the axis on the graph or as a result of conversion.
Almost all candidates gained the mark for drawing a best-fit curve through the data points on the graph, though some insisted in trying to put a straight line through obviously non-linear data. Many students identified the inverse proportionality of pressure and volume in Part (b), though the terminology often lacked precision. Most students could identify the correct equation to use in Part (c) in order to calculate the amount of gas from the specified data point, though quite often they had problems with units, either as a result of incorrectly reading the axis on the graph or as a result of conversion.