| Date | May 2013 | Marks available | 4 | Reference code | 13M.1.sl.TZ2.8 |
| Level | SL only | Paper | 1 | Time zone | TZ2 |
| Command term | Find and Write down | Question number | 8 | Adapted from | N/A |
Question
A running club organizes a race to select girls to represent the club in a competition.
The times taken by the group of girls to complete the race are shown in the table below.
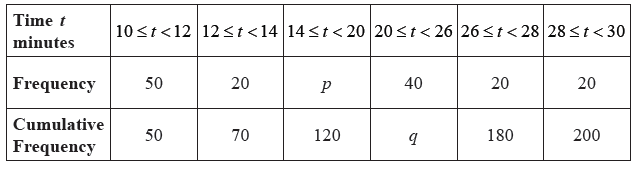
Find the value of \(p\) and of \(q\) .
A girl is chosen at random.
(i) Find the probability that the time she takes is less than \(14\) minutes.
(ii) Find the probability that the time she takes is at least \(26\) minutes.
A girl is selected for the competition if she takes less than \(x\) minutes to complete the race.
Given that \(40\%\) of the girls are not selected,
(i) find the number of girls who are not selected;
(ii) find \(x\) .
Girls who are not selected, but took less than \(25\) minutes to complete the race, are allowed another chance to be selected. The new times taken by these girls are shown in the cumulative frequency diagram below.
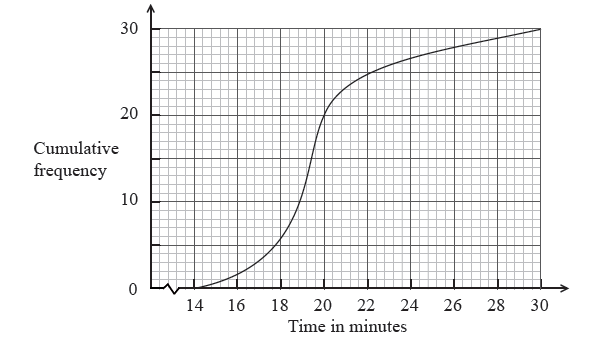
(i) Write down the number of girls who were allowed another chance.
(ii) Find the percentage of the whole group who were selected.
Markscheme
attempt to find \(p\) (M1)
eg \(120 - 70\) , \(50 + 20 + x = 120\)
\(p = 50\) A1 N2
attempt to find \(q\) (M1)
eg \(180 - 20\) , \(200 - 20 - 20\)
\(q = 160\) A1 N2
[4 marks]
(i) \(\frac{{70}}{{200}}\) \(\left( { = \frac{7}{{20}}} \right)\) A1 N1
(ii) valid approach (M1)
eg \(20 + 20\) , \(200 - 160\)
\(\frac{{40}}{{200}}\) \(\left( { = \frac{1}{5}} \right)\) A1 N2
[3 marks]
(i) attempt to find number of girls (M1)
eg \(0.4\), \(\frac{{40}}{{100}} \times 200\)
\(80\) are not selected A1 N2
(ii) \(120\) are selected (A1)
\(x = 20\) A1 N2
[4 marks]
(i) \(30\) given second chance A1 N1
(ii) \(20\) took less than \(20\) minutes (A1)
attempt to find their selected total (may be seen in \(\%\) calculation) (M1)
eg \(120 + 20\) \(( = 140)\) , \(120 + \) their answer from (i)
\(70\) (\(\%\)) A1 N3
[4 marks]
Examiners report
Overall, candidates were very successful in parts (a), (b) and (c) of this question. Most of the errors in these parts had to do with candidates not understanding terms such as "at least" or "less than".
Overall, candidates were very successful in parts (a), (b) and (c) of this question. Most of the errors in these parts had to do with candidates not understanding terms such as "at least" or "less than".
Overall, candidates were very successful in parts (a), (b) and (c) of this question. Most of the errors in these parts had to do with candidates not understanding terms such as "at least" or "less than".
Part (d) was quite challenging for candidates, who may not have read the question carefully and studied the values in the diagram. Many seemed confused by the idea that not all the girls who were given a second chance were selected. In part (d)(ii), many did not find the percentage of the whole group, but rather the percentage of the girls who were given a second chance.