| Date | May 2010 | Marks available | 4 | Reference code | 10M.2.sl.TZ2.1 |
| Level | SL only | Paper | 2 | Time zone | TZ2 |
| Command term | Find | Question number | 1 | Adapted from | N/A |
Question
The following table gives the examination grades for 120 students.
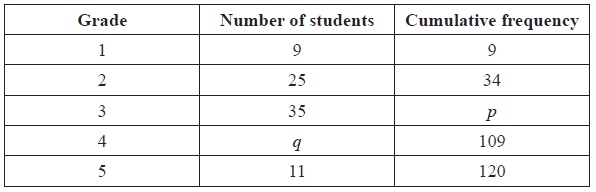
Find the value of
(i) p ;
(ii) q .
Find the mean grade.
Write down the standard deviation.
Markscheme
(a) (i) evidence of appropriate approach (M1)
e.g. \(9 + 25 + 35\) , \(34 + 35\)
\(p = 69\) A1 N2
(ii) evidence of valid approach (M1)
e.g. \(109 - \) their value of p, \(120 - (9 + 25 + 35 + 11)\)
\(q = 40\) A1 N2
[4 marks]
evidence of appropriate approach (M1)
e.g. substituting into \(\frac{{\sum {fx} }}{n}\), division by 120
mean \(= 3.16\) A1 N2
[2 marks]
1.09 A1 N1
[1 mark]
Examiners report
The majority of candidates had little trouble finding the missing values in the frequency distribution table.
Many did not seem comfortable calculating the mean and standard deviation using their GDCs.
The correct mean was often found without the use of the statistical functions on the graphing calculator, but a large number of candidates were unable to find the standard deviation.
Many did not seem comfortable calculating the mean and standard deviation using their GDCs.
The correct mean was often found without the use of the statistical functions on the graphing calculator, but a large number of candidates were unable to find the standard deviation.