| Date | November 2011 | Marks available | 1 | Reference code | 11N.2.sl.TZ0.2 |
| Level | SL only | Paper | 2 | Time zone | TZ0 |
| Command term | Write down | Question number | 2 | Adapted from | N/A |
Question
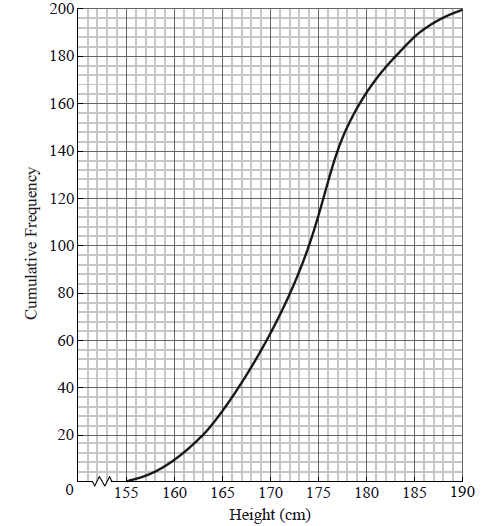
The cumulative frequency curve below represents the heights of 200 sixteen-year-old boys.
Use the graph to answer the following.
Write down the median value.
A boy is chosen at random. Find the probability that he is shorter than \(161{\text{ cm}}\).
Given that \(82\% \) of the boys are taller than \(h{\text{ cm}}\), find h .
Markscheme
\({\text{median}} = 174 {\text{(cm)}}\) A1 N1
[1 mark]
attempt to find number shorter than 161 (M1)
e.g. line on graph, 12 boys
\(p = \frac{{12}}{{200}}( = 0.06)\) A1 N2
[2 marks]
METHOD 1
\(18\% \) have a height less than h (A1)
\(0.18 \times 200 = 36\) (36 may be seen as a line on the graph) (A1)
\(h = 166\) (cm) A1 N2
METHOD 2
\(0.82 \times 200 = 164\) (164 may be seen as a line on the graph) (A1)
\(200 - 164 = 36\) (A1)
\(h = 166\) (cm) A1 N2
[3 marks]
Examiners report
Parts (a) and (b) were generally well done.
Parts (a) and (b) were generally well done.
Some candidates could only earn the first mark in part (c) for finding \(82\% \) of 200. Others gave the answer as 164, neglecting to subtract this value from the total of 200.