| Date | May 2016 | Marks available | 3 | Reference code | 16M.1.sl.TZ1.8 |
| Level | SL only | Paper | 1 | Time zone | TZ1 |
| Command term | Find and Write down | Question number | 8 | Adapted from | N/A |
Question
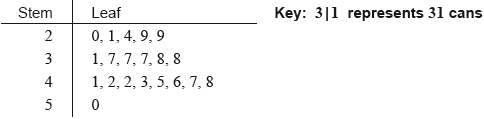
A school collects cans for recycling to raise money. Sam’s class has 20 students.
The number of cans collected by each student in Sam’s class is shown in the following stem and leaf diagram.
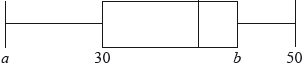
The following box-and-whisker plot also displays the number of cans collected by students in Sam’s class.
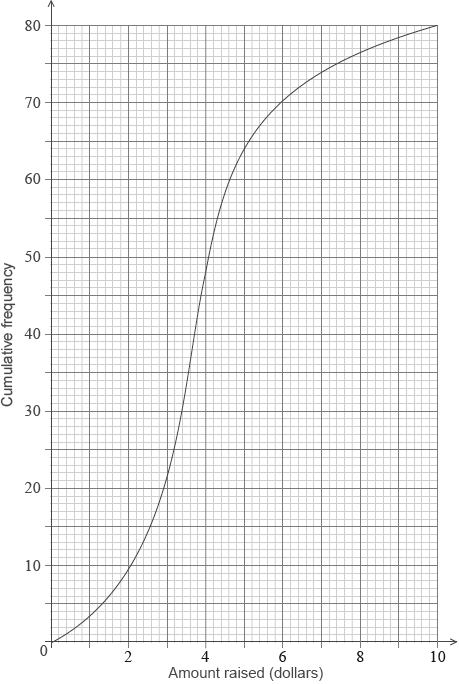
There are 80 students in the school.
The mean number of cans collected is 39.4. The standard deviation is 18.5.
Each student then collects 2 more cans.
Find the median number of cans collected.
(i) Write down the value of \(a\).
(ii) The interquartile range is 14. Find the value of \(b\).
Sam’s class collected 745 cans. They want an average of 40 cans per student.
How many more cans need to be collected to achieve this target?
The students raise $0.10 for each recycled can.
(i) Find the largest amount raised by a student in Sam’s class.
(ii) The following cumulative frequency curve shows the amounts in dollars raised by all the students in the school. Find the percentage of students in the school who raised more money than anyone in Sam’s class.

(i) Write down the new mean.
(ii) Write down the new standard deviation.
Markscheme
valid approach (M1)
eg\(\,\,\,\,\,\)between 10th and 11th, \(\frac{{8 + 8}}{2}\)
median \( = 38\) A1 N2
[2 marks]
(i) \(a = 20\) A1 N1
(ii) valid approach (M1)
eg\(\,\,\,\,\,\)\({Q_3} - {Q_1},{\text{ }}{Q_1} + 14,{\text{ }}b - 30 = 14\)
\(b = 44\) A1 N2
[3 marks]
valid approach (M1)
egx\(\,\,\,\,\,\)\(40 \times 20,{\text{ }}\frac{{x + 745}}{{20}},{\text{ }}40 - \frac{{745}}{{20}}\)
correct working (A1)
eg\(\,\,\,\,\,\)\(800 - 745,{\text{ }}20 \times 2.75\)
55 (more cans) A1 N2
[3 marks]
(i) most cans in Sam’s class \( = 50\) (A1)
5 ($) A1 N2
(ii) correct value of 64 or 16 A1
valid approach (M1)
eg\(\,\,\,\,\,\)\(\frac{{64}}{{80}},{\text{ }}80\% ,{\text{ }}80 - 64,{\text{ }}\frac{{16}}{{80}}\)
20% A1 N2
[5 marks]
(i) 41.4 (exact) A1 N1
(ii) 18.5 A1 N1
[2 marks]
Examiners report
Generally, candidates were very successful with this question, appearing to move easily between the three different representations of data. The main conceptual errors appeared in part d) where a percentage of 100 was found (instead of 80) and in part e) where the new standard deviation was often given as 20.5. Arithmetic errors seemed to be the other factor, with a surprising number of candidates finding in part c) that \(800 - 745 = 15\).
Generally, candidates were very successful with this question, appearing to move easily between the three different representations of data. The main conceptual errors appeared in part d) where a percentage of 100 was found (instead of 80) and in part e) where the new standard deviation was often given as 20.5. Arithmetic errors seemed to be the other factor, with a surprising number of candidates finding in part c) that \(800 - 745 = 15\).
Generally, candidates were very successful with this question, appearing to move easily between the three different representations of data. The main conceptual errors appeared in part d) where a percentage of 100 was found (instead of 80) and in part e) where the new standard deviation was often given as 20.5. Arithmetic errors seemed to be the other factor, with a surprising number of candidates finding in part c) that \(800 - 745 = 15\).
Generally, candidates were very successful with this question, appearing to move easily between the three different representations of data. The main conceptual errors appeared in part d) where a percentage of 100 was found (instead of 80) and in part e) where the new standard deviation was often given as 20.5. Arithmetic errors seemed to be the other factor, with a surprising number of candidates finding in part c) that \(800 - 745 = 15\).
Generally, candidates were very successful with this question, appearing to move easily between the three different representations of data. The main conceptual errors appeared in part d) where a percentage of 100 was found (instead of 80) and in part e) where the new standard deviation was often given as 20.5. Arithmetic errors seemed to be the other factor, with a surprising number of candidates finding in part c) that \(800 - 745 = 15\).