| Date | November 2014 | Marks available | 2 | Reference code | 14N.2.sl.TZ0.8 |
| Level | SL only | Paper | 2 | Time zone | TZ0 |
| Command term | Find | Question number | 8 | Adapted from | N/A |
Question
The following cumulative frequency graph shows the monthly income, \(I\) dollars, of \(2000\) families.
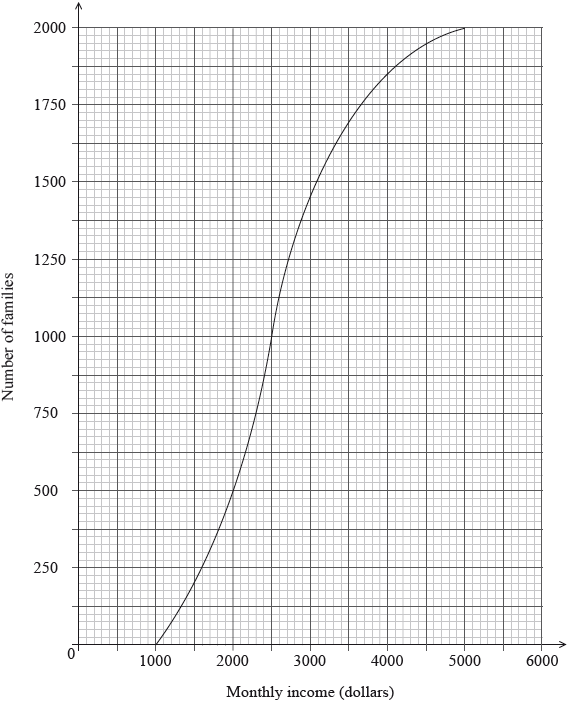
Find the median monthly income.
(i) Write down the number of families who have a monthly income of \(2000\) dollars or less.
(ii) Find the number of families who have a monthly income of more than \(4000\) dollars.
The \(2000\) families live in two different types of housing. The following table gives information about the number of families living in each type of housing and their monthly income \(I\).
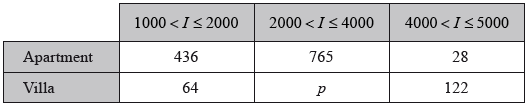
Find the value of \(p\).
A family is chosen at random.
(i) Find the probability that this family lives in an apartment.
(ii) Find the probability that this family lives in an apartment, given that its monthly income is greater than \(4000\) dollars.
Estimate the mean monthly income for families living in a villa.
Markscheme
recognizing that the median is at half the total frequency (M1)
eg\(\;\;\;\)\(\frac{{2000}}{2}\)
\(m = 2500{\text{ (dollars)}}\) A1 N2
[2 marks]
(i) \(500\) families have a monthly income less than \(2000\) A1 N1
(ii) correct cumulative frequency, \(1850\) (A1)
subtracting their cumulative frequency from \(2000\) (M1)
eg\(\;\;\;\)\(2000 - 1850\)
\(150\) families have a monthly income of more than \(4000\) dollars A1 N2
Note: If working shown, award M1A1A1 for \(128{\rm{ }} + {\rm{ }}22{\rm{ }} = {\rm{ }}150\), using the table.
[4 marks]
correct calculation (A1)
eg\(\;\;\;\)\(2000 - (436 + 64 + 765 + 28 + 122),{\text{ }}1850 - 500 - 765\) (A1)
\(p = 585\) A1 N2
[2 marks]
(i) correct working (A1)
eg\(\;\;\;\)\(436 + 765 + 28\)
\(0.6145\;\;\;\)(exact) A1 N2
\(\frac{{1229}}{{2000}},{\text{ }}0.615{\text{ }}[0.614,{\text{ }}0.615]\)
(ii) correct working/probability for number of families (A1)
eg\(\;\;\;\)\(122 + 28,{\text{ }}\frac{{150}}{{2000}},{\text{ 0.075}}\)
\(0.186666\)
\(\frac{{28}}{{150}}\;\;\;\left( { = \frac{{14}}{{75}}} \right),{\text{ }}0.187{\text{ }}[0.186,{\text{ }}0.187]\) A1 N2
[4 marks]
evidence of using correct mid-interval values (\(1500,{\rm{ }}3000,{\rm{ }}4500\)) (A1)
attempt to substitute into \(\frac{{\sum {fx} }}{{\sum f }}\) (M1)
eg\(\;\;\;\)\(\frac{{1500 \times 64 + 3000 \times p + 4500 \times 122}}{{64 + 585 + 122}}\)
\(3112.84\)
\(3110{\text{ }}[3110,{\text{ }}3120]{\text{ (dollars)}}\) A1 N2
[3 marks]
Total [15 marks]
Examiners report
This question was well handled by most candidates. Except for miscalculations and incorrect readings from the cumulative frequency graph, the processes and concepts seemed to be well understood by the majority.
A number of students did not gain full marks in parts (bii) and (e), for not showing their process. In part (c), some candidates wrote things like “using GDC”, without showing relevant work, and so lost marks. Those who chose a formulaic approach to the conditional probability question in (dii) were often not as successful as those who could interpret the question in terms of the table values.
A large number of candidates could not find the mean value in (e). Some used the incorrect mid-interval values and others did not consider their use.